FlexsharesCore BNDC full analysis,charts,indicators,moving averages,SMA,DMA,EMA,ADX,MACD,RSIFlexshares Core BNDC WideScreen charts, DMA,SMA,EMA technical analysis, forecast prediction, by indicators ADX,MACD,RSI,CCI AMEX stock exchange
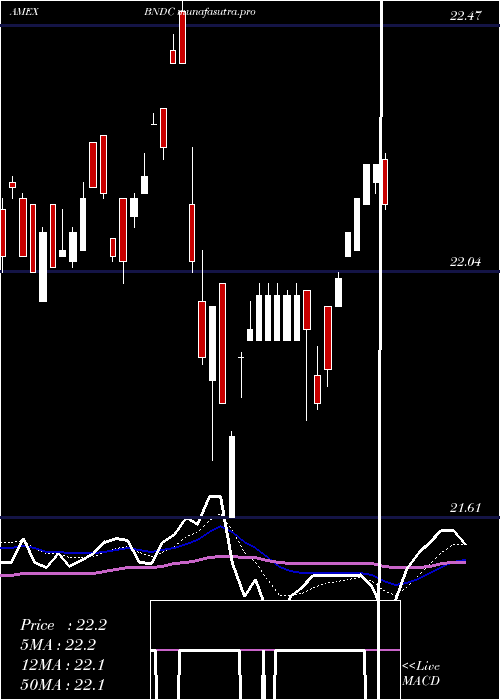
Daily price and charts and targets FlexsharesCore Strong Daily Stock price targets for FlexsharesCore BNDC are 22.66 and 22.77 | Daily Target 1 | 22.57 | | Daily Target 2 | 22.63 | | Daily Target 3 | 22.68 | | Daily Target 4 | 22.74 | | Daily Target 5 | 22.79 |
Daily price and volume Flexshares Core
| Date |
Closing |
Open |
Range |
Volume |
Fri 24 October 2025 |
22.69 (0.04%) |
22.62 |
22.62 - 22.73 |
2.3222 times |
Thu 23 October 2025 |
22.68 (-0.18%) |
22.68 |
22.68 - 22.68 |
0.2595 times |
Wed 22 October 2025 |
22.72 (0.04%) |
22.69 |
22.69 - 22.73 |
0.225 times |
Tue 21 October 2025 |
22.71 (0.09%) |
22.71 |
22.71 - 22.73 |
1.2202 times |
Mon 20 October 2025 |
22.69 (0.22%) |
22.67 |
22.66 - 22.69 |
0.6299 times |
Fri 17 October 2025 |
22.64 (-0.18%) |
22.65 |
22.62 - 22.66 |
0.5185 times |
Thu 16 October 2025 |
22.68 (0.35%) |
22.60 |
22.58 - 22.69 |
1.2329 times |
Wed 15 October 2025 |
22.60 (0%) |
22.64 |
22.57 - 22.65 |
0.3265 times |
Tue 14 October 2025 |
22.60 (0.09%) |
22.57 |
22.55 - 22.61 |
1.0827 times |
Mon 13 October 2025 |
22.58 (0.18%) |
22.56 |
22.49 - 22.58 |
2.1826 times |
Fri 10 October 2025 |
22.54 (0.36%) |
22.46 |
22.46 - 22.54 |
0.275 times |
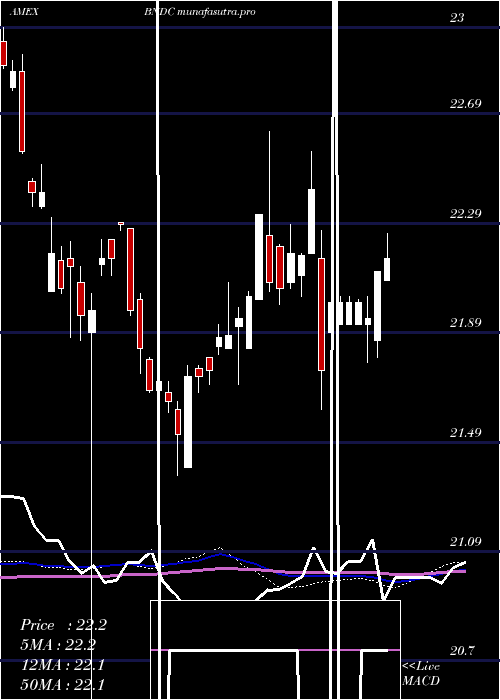
Weekly price and charts FlexsharesCore Strong weekly Stock price targets for FlexsharesCore BNDC are 22.66 and 22.77 | Weekly Target 1 | 22.57 | | Weekly Target 2 | 22.63 | | Weekly Target 3 | 22.68 | | Weekly Target 4 | 22.74 | | Weekly Target 5 | 22.79 |
Weekly price and volumes for Flexshares Core
| Date |
Closing |
Open |
Range |
Volume |
Fri 24 October 2025 |
22.69 (0.22%) |
22.67 |
22.62 - 22.73 |
0.5995 times |
Fri 17 October 2025 |
22.64 (0.44%) |
22.56 |
22.49 - 22.69 |
0.6879 times |
Fri 10 October 2025 |
22.54 (-0.04%) |
22.53 |
22.43 - 22.54 |
0.5144 times |
Fri 03 October 2025 |
22.55 (0.45%) |
22.49 |
22.47 - 22.59 |
0.8967 times |
Fri 26 September 2025 |
22.45 (-0.27%) |
22.35 |
22.35 - 22.54 |
0.5111 times |
Fri 19 September 2025 |
22.51 (-0.18%) |
22.66 |
22.47 - 22.69 |
0.6085 times |
Fri 12 September 2025 |
22.55 (0.13%) |
22.51 |
22.48 - 22.62 |
2.5135 times |
Fri 05 September 2025 |
22.52 (0.94%) |
22.24 |
22.22 - 22.56 |
1.478 times |
Fri 29 August 2025 |
22.31 (0%) |
22.29 |
22.29 - 22.31 |
0.5399 times |
Fri 29 August 2025 |
22.31 (0.13%) |
22.25 |
22.16 - 22.38 |
1.6506 times |
Fri 22 August 2025 |
22.28 (0.41%) |
22.17 |
22.11 - 22.30 |
0.8607 times |
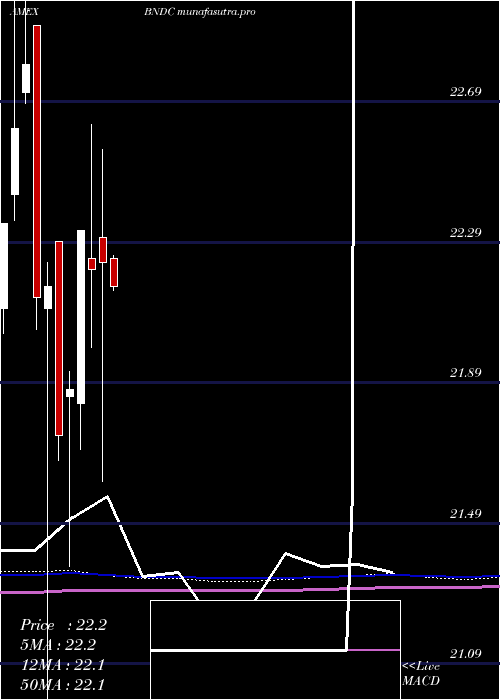
Monthly price and charts FlexsharesCore Strong monthly Stock price targets for FlexsharesCore BNDC are 22.56 and 22.86 | Monthly Target 1 | 22.32 | | Monthly Target 2 | 22.5 | | Monthly Target 3 | 22.616666666667 | | Monthly Target 4 | 22.8 | | Monthly Target 5 | 22.92 |
Monthly price and volumes Flexshares Core
| Date |
Closing |
Open |
Range |
Volume |
Fri 24 October 2025 |
22.69 (0.84%) |
22.57 |
22.43 - 22.73 |
0.2661 times |
Tue 30 September 2025 |
22.50 (0.85%) |
22.24 |
22.22 - 22.69 |
0.5818 times |
Fri 29 August 2025 |
22.31 (0.86%) |
22.27 |
22.11 - 22.38 |
0.4254 times |
Thu 31 July 2025 |
22.12 (-0.67%) |
22.23 |
21.91 - 22.27 |
0.303 times |
Mon 30 June 2025 |
22.27 (1.18%) |
21.98 |
21.80 - 22.53 |
0.5396 times |
Fri 30 May 2025 |
22.01 (-0.99%) |
22.24 |
21.71 - 22.25 |
1.2698 times |
Wed 30 April 2025 |
22.23 (0.09%) |
22.30 |
21.61 - 22.55 |
0.9612 times |
Mon 31 March 2025 |
22.21 (-0.49%) |
22.24 |
21.99 - 22.62 |
1.4785 times |
Fri 28 February 2025 |
22.32 (2.06%) |
21.83 |
21.70 - 22.32 |
1.2686 times |
Fri 31 January 2025 |
21.87 (0.6%) |
21.85 |
21.37 - 21.92 |
2.906 times |
Tue 31 December 2024 |
21.74 (-1.9%) |
22.29 |
21.67 - 22.29 |
0.5664 times |
DMA SMA EMA moving averages of Flexshares Core BNDC
DMA (daily moving average) of Flexshares Core BNDC
| DMA period | DMA value | | 5 day DMA | 22.7 | | 12 day DMA | 22.63 | | 20 day DMA | 22.59 | | 35 day DMA | 22.56 | | 50 day DMA | 22.48 | | 100 day DMA | 22.29 | | 150 day DMA | 22.2 | | 200 day DMA | 22.14 | EMA (exponential moving average) of Flexshares Core BNDC
| EMA period | EMA current | EMA prev | EMA prev2 | | 5 day EMA | 22.68 | 22.68 | 22.68 | | 12 day EMA | 22.65 | 22.64 | 22.63 | | 20 day EMA | 22.6 | 22.59 | 22.58 | | 35 day EMA | 22.54 | 22.53 | 22.52 | | 50 day EMA | 22.48 | 22.47 | 22.46 |
SMA (simple moving average) of Flexshares Core BNDC
| SMA period | SMA current | SMA prev | SMA prev2 | | 5 day SMA | 22.7 | 22.69 | 22.69 | | 12 day SMA | 22.63 | 22.62 | 22.6 | | 20 day SMA | 22.59 | 22.57 | 22.56 | | 35 day SMA | 22.56 | 22.55 | 22.55 | | 50 day SMA | 22.48 | 22.47 | 22.46 | | 100 day SMA | 22.29 | 22.29 | 22.28 | | 150 day SMA | 22.2 | 22.19 | 22.19 | | 200 day SMA | 22.14 | 22.13 | 22.12 |
|
|
