BnyMellon BKLC full analysis,charts,indicators,moving averages,SMA,DMA,EMA,ADX,MACD,RSIBny Mellon BKLC WideScreen charts, DMA,SMA,EMA technical analysis, forecast prediction, by indicators ADX,MACD,RSI,CCI AMEX stock exchange
Daily price and charts and targets BnyMellon Strong Daily Stock price targets for BnyMellon BKLC are 130.02 and 130.43 | Daily Target 1 | 129.72 | | Daily Target 2 | 129.91 | | Daily Target 3 | 130.13333333333 | | Daily Target 4 | 130.32 | | Daily Target 5 | 130.54 |
Daily price and volume Bny Mellon
| Date |
Closing |
Open |
Range |
Volume |
Fri 24 October 2025 |
130.09 (0.81%) |
130.00 |
129.95 - 130.36 |
0.3818 times |
Thu 23 October 2025 |
129.04 (0.63%) |
128.33 |
128.27 - 129.23 |
0.7963 times |
Wed 22 October 2025 |
128.23 (-0.55%) |
129.12 |
127.40 - 129.12 |
0.7742 times |
Tue 21 October 2025 |
128.94 (-0.04%) |
129.04 |
128.75 - 129.30 |
1.8706 times |
Mon 20 October 2025 |
128.99 (1.08%) |
128.22 |
128.22 - 129.14 |
0.4847 times |
Fri 17 October 2025 |
127.61 (0.53%) |
126.71 |
126.49 - 130.53 |
0.5459 times |
Thu 16 October 2025 |
126.94 (-0.63%) |
128.20 |
126.40 - 128.46 |
2.7981 times |
Wed 15 October 2025 |
127.75 (0.37%) |
128.19 |
126.80 - 128.75 |
0.8758 times |
Tue 14 October 2025 |
127.28 (-0.11%) |
126.27 |
125.60 - 127.88 |
0.8519 times |
Mon 13 October 2025 |
127.42 (1.58%) |
126.98 |
126.76 - 127.65 |
0.6208 times |
Fri 10 October 2025 |
125.44 (-2.7%) |
129.10 |
125.44 - 129.44 |
1.0566 times |
Weekly price and charts BnyMellon Strong weekly Stock price targets for BnyMellon BKLC are 128.75 and 131.71 | Weekly Target 1 | 126.32 | | Weekly Target 2 | 128.21 | | Weekly Target 3 | 129.28333333333 | | Weekly Target 4 | 131.17 | | Weekly Target 5 | 132.24 |
Weekly price and volumes for Bny Mellon
| Date |
Closing |
Open |
Range |
Volume |
Fri 24 October 2025 |
130.09 (1.94%) |
128.22 |
127.40 - 130.36 |
0.811 times |
Fri 17 October 2025 |
127.61 (1.73%) |
126.98 |
125.60 - 130.53 |
1.0718 times |
Fri 10 October 2025 |
125.44 (-2.38%) |
129.09 |
125.44 - 129.44 |
0.8379 times |
Fri 03 October 2025 |
128.50 (0.81%) |
128.06 |
127.43 - 129.18 |
1.438 times |
Fri 26 September 2025 |
127.47 (-0.38%) |
127.68 |
126.16 - 128.62 |
0.8048 times |
Fri 19 September 2025 |
127.96 (1.4%) |
126.71 |
125.71 - 128.02 |
0.6549 times |
Fri 12 September 2025 |
126.19 (1.67%) |
124.51 |
124.25 - 126.55 |
1.2477 times |
Fri 05 September 2025 |
124.12 (0.39%) |
122.18 |
121.80 - 125.13 |
2.1002 times |
Fri 29 August 2025 |
123.64 (0%) |
124.25 |
123.43 - 124.25 |
0.3001 times |
Fri 29 August 2025 |
123.64 (-0.06%) |
123.48 |
123.03 - 124.60 |
0.7336 times |
Fri 22 August 2025 |
123.72 (0.32%) |
123.31 |
121.29 - 123.96 |
0.5705 times |
Monthly price and charts BnyMellon Strong monthly Stock price targets for BnyMellon BKLC are 127.77 and 132.86 | Monthly Target 1 | 123.6 | | Monthly Target 2 | 126.84 | | Monthly Target 3 | 128.68666666667 | | Monthly Target 4 | 131.93 | | Monthly Target 5 | 133.78 |
Monthly price and volumes Bny Mellon
| Date |
Closing |
Open |
Range |
Volume |
Fri 24 October 2025 |
130.09 (1.33%) |
127.43 |
125.44 - 130.53 |
0.6071 times |
Tue 30 September 2025 |
128.38 (3.83%) |
122.18 |
121.80 - 128.62 |
0.8903 times |
Fri 29 August 2025 |
123.64 (1.53%) |
120.20 |
118.84 - 124.60 |
0.4818 times |
Thu 31 July 2025 |
121.78 (2.83%) |
118.20 |
118.00 - 122.77 |
0.7354 times |
Mon 30 June 2025 |
118.43 (4.49%) |
112.64 |
112.20 - 119.07 |
0.6899 times |
Fri 30 May 2025 |
113.34 (7.13%) |
107.13 |
106.48 - 114.32 |
2.3062 times |
Wed 30 April 2025 |
105.80 (-0.49%) |
106.22 |
91.90 - 108.14 |
2.5633 times |
Mon 31 March 2025 |
106.32 (-6.4%) |
113.96 |
104.60 - 114.14 |
0.6463 times |
Fri 28 February 2025 |
113.59 (-1.6%) |
113.57 |
111.37 - 117.50 |
0.4894 times |
Fri 31 January 2025 |
115.44 (3.02%) |
112.74 |
110.15 - 117.07 |
0.5904 times |
Tue 31 December 2024 |
112.06 (-2.52%) |
115.44 |
111.55 - 116.48 |
0.6016 times |

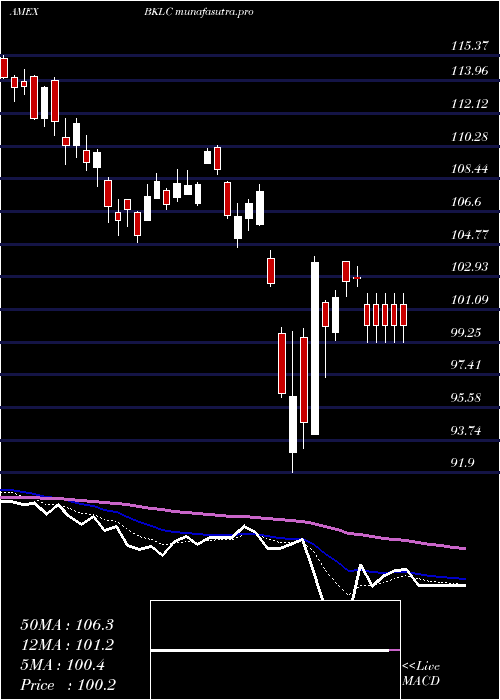
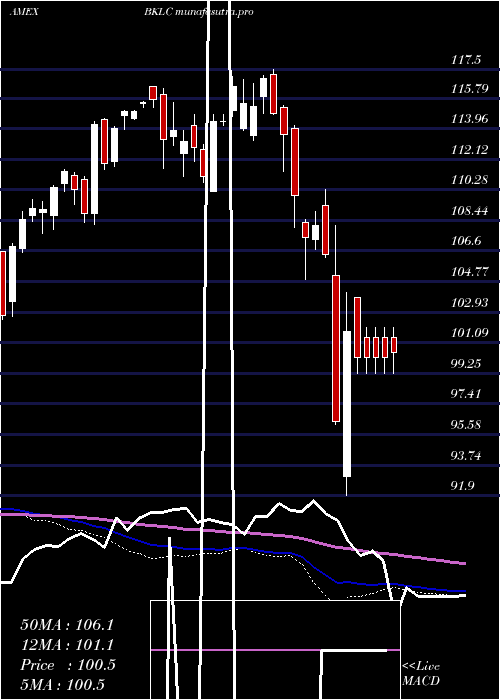
DMA SMA EMA moving averages of Bny Mellon BKLC
DMA (daily moving average) of Bny Mellon BKLC
| DMA period | DMA value | | 5 day DMA | 129.06 | | 12 day DMA | 128.05 | | 20 day DMA | 128.25 | | 35 day DMA | 127.59 | | 50 day DMA | 126.35 | | 100 day DMA | 122.66 | | 150 day DMA | 117.22 | | 200 day DMA | 116.16 | EMA (exponential moving average) of Bny Mellon BKLC
| EMA period | EMA current | EMA prev | EMA prev2 | | 5 day EMA | 129.05 | 128.53 | 128.27 | | 12 day EMA | 128.48 | 128.19 | 128.03 | | 20 day EMA | 128.11 | 127.9 | 127.78 | | 35 day EMA | 127.19 | 127.02 | 126.9 | | 50 day EMA | 126.37 | 126.22 | 126.1 |
SMA (simple moving average) of Bny Mellon BKLC
| SMA period | SMA current | SMA prev | SMA prev2 | | 5 day SMA | 129.06 | 128.56 | 128.14 | | 12 day SMA | 128.05 | 127.99 | 127.94 | | 20 day SMA | 128.25 | 128.12 | 128.01 | | 35 day SMA | 127.59 | 127.42 | 127.29 | | 50 day SMA | 126.35 | 126.21 | 126.11 | | 100 day SMA | 122.66 | 122.5 | 122.34 | | 150 day SMA | 117.22 | 117.07 | 116.93 | | 200 day SMA | 116.16 | 116.07 | 115.99 |
|
|
