BricIndex BKF full analysis,charts,indicators,moving averages,SMA,DMA,EMA,ADX,MACD,RSIBric Index BKF WideScreen charts, DMA,SMA,EMA technical analysis, forecast prediction, by indicators ADX,MACD,RSI,CCI AMEX stock exchange
Daily price and charts and targets BricIndex Strong Daily Stock price targets for BricIndex BKF are 45.23 and 45.39 | Daily Target 1 | 45.2 | | Daily Target 2 | 45.26 | | Daily Target 3 | 45.363333333333 | | Daily Target 4 | 45.42 | | Daily Target 5 | 45.52 |
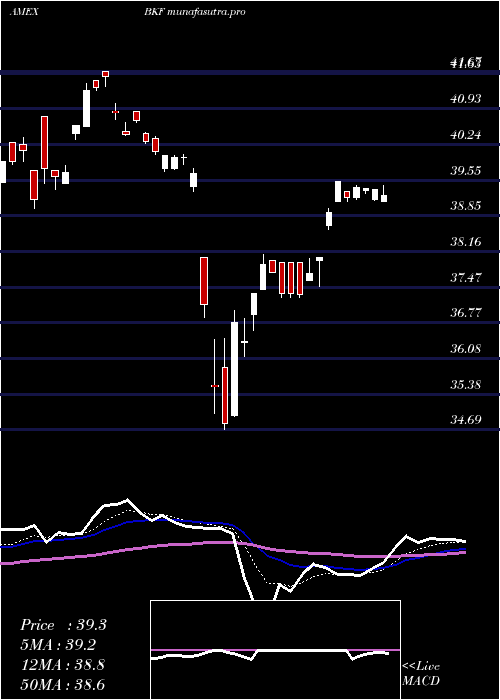
Daily price and volume Bric Index
| Date |
Closing |
Open |
Range |
Volume |
Fri 24 October 2025 |
45.31 (-0.04%) |
45.47 |
45.31 - 45.47 |
2.1034 times |
Thu 23 October 2025 |
45.33 (0.91%) |
45.05 |
45.05 - 45.53 |
1.859 times |
Wed 22 October 2025 |
44.92 (-0.09%) |
44.06 |
44.06 - 45.15 |
0.6002 times |
Tue 21 October 2025 |
44.96 (-1.06%) |
45.09 |
44.93 - 45.09 |
0.3165 times |
Mon 20 October 2025 |
45.44 (1.38%) |
44.85 |
44.85 - 45.44 |
0.3915 times |
Fri 17 October 2025 |
44.82 (0.36%) |
44.24 |
44.24 - 44.94 |
0.3774 times |
Thu 16 October 2025 |
44.66 (0.2%) |
44.91 |
44.60 - 44.98 |
0.2372 times |
Wed 15 October 2025 |
44.57 (1.23%) |
44.53 |
44.42 - 44.73 |
1.12 times |
Tue 14 October 2025 |
44.03 (-0.99%) |
43.90 |
43.77 - 44.29 |
1.8505 times |
Mon 13 October 2025 |
44.47 (2.04%) |
44.53 |
44.36 - 44.65 |
1.1444 times |
Fri 10 October 2025 |
43.58 (-3.28%) |
45.00 |
43.47 - 45.31 |
5.0644 times |
Weekly price and charts BricIndex Strong weekly Stock price targets for BricIndex BKF are 44.69 and 46.16 | Weekly Target 1 | 43.5 | | Weekly Target 2 | 44.4 | | Weekly Target 3 | 44.966666666667 | | Weekly Target 4 | 45.87 | | Weekly Target 5 | 46.44 |
Weekly price and volumes for Bric Index
| Date |
Closing |
Open |
Range |
Volume |
Fri 24 October 2025 |
45.31 (1.09%) |
44.85 |
44.06 - 45.53 |
0.8835 times |
Fri 17 October 2025 |
44.82 (2.85%) |
44.53 |
43.77 - 44.98 |
0.7928 times |
Fri 10 October 2025 |
43.58 (-4.53%) |
45.75 |
43.47 - 45.97 |
1.4677 times |
Fri 03 October 2025 |
45.65 (2.19%) |
45.17 |
45.13 - 46.03 |
0.7867 times |
Fri 26 September 2025 |
44.67 (-1.24%) |
44.99 |
44.50 - 45.18 |
1.7959 times |
Fri 19 September 2025 |
45.23 (1.19%) |
45.05 |
44.90 - 45.83 |
0.7877 times |
Fri 12 September 2025 |
44.70 (3.09%) |
43.67 |
43.62 - 44.83 |
1.151 times |
Fri 05 September 2025 |
43.36 (0.51%) |
43.26 |
42.72 - 43.44 |
0.8694 times |
Fri 29 August 2025 |
43.14 (0%) |
43.07 |
42.92 - 43.16 |
0.2612 times |
Fri 29 August 2025 |
43.14 (-0.8%) |
43.59 |
42.54 - 43.71 |
1.2041 times |
Fri 22 August 2025 |
43.49 (2.52%) |
42.86 |
42.60 - 43.51 |
0.9837 times |

Monthly price and charts BricIndex Strong monthly Stock price targets for BricIndex BKF are 43.11 and 45.67 | Monthly Target 1 | 42.38 | | Monthly Target 2 | 43.84 | | Monthly Target 3 | 44.936666666667 | | Monthly Target 4 | 46.4 | | Monthly Target 5 | 47.5 |
Monthly price and volumes Bric Index
| Date |
Closing |
Open |
Range |
Volume |
Fri 24 October 2025 |
45.31 (0.18%) |
45.48 |
43.47 - 46.03 |
0.4404 times |
Tue 30 September 2025 |
45.23 (4.84%) |
43.26 |
42.72 - 45.83 |
0.5805 times |
Fri 29 August 2025 |
43.14 (4.38%) |
41.07 |
40.85 - 43.71 |
0.664 times |
Thu 31 July 2025 |
41.33 (-0.31%) |
41.56 |
41.04 - 42.83 |
0.7955 times |
Mon 30 June 2025 |
41.46 (3.37%) |
40.21 |
40.10 - 41.74 |
0.4604 times |
Fri 30 May 2025 |
40.11 (1.91%) |
39.13 |
39.13 - 41.41 |
0.9101 times |
Wed 30 April 2025 |
39.36 (-1.65%) |
39.78 |
34.69 - 40.04 |
1.4325 times |
Mon 31 March 2025 |
40.02 (4.11%) |
38.61 |
38.03 - 41.67 |
3.0688 times |
Fri 28 February 2025 |
38.44 (3.56%) |
36.66 |
36.66 - 40.22 |
0.9384 times |
Fri 31 January 2025 |
37.12 (1.73%) |
36.49 |
34.78 - 37.59 |
0.7092 times |
Tue 31 December 2024 |
36.49 (-2.51%) |
37.80 |
36.46 - 39.97 |
0.411 times |

DMA SMA EMA moving averages of Bric Index BKF
DMA (daily moving average) of Bric Index BKF
| DMA period | DMA value | | 5 day DMA | 45.19 | | 12 day DMA | 44.76 | | 20 day DMA | 45.07 | | 35 day DMA | 44.96 | | 50 day DMA | 44.4 | | 100 day DMA | 42.95 | | 150 day DMA | 41.77 | | 200 day DMA | 40.85 | EMA (exponential moving average) of Bric Index BKF
| EMA period | EMA current | EMA prev | EMA prev2 | | 5 day EMA | 45.14 | 45.06 | 44.93 | | 12 day EMA | 45.01 | 44.96 | 44.89 | | 20 day EMA | 44.94 | 44.9 | 44.85 | | 35 day EMA | 44.6 | 44.56 | 44.51 | | 50 day EMA | 44.28 | 44.24 | 44.2 |
SMA (simple moving average) of Bric Index BKF
| SMA period | SMA current | SMA prev | SMA prev2 | | 5 day SMA | 45.19 | 45.09 | 44.96 | | 12 day SMA | 44.76 | 44.78 | 44.8 | | 20 day SMA | 45.07 | 45.04 | 45.02 | | 35 day SMA | 44.96 | 44.9 | 44.83 | | 50 day SMA | 44.4 | 44.34 | 44.27 | | 100 day SMA | 42.95 | 42.9 | 42.85 | | 150 day SMA | 41.77 | 41.74 | 41.72 | | 200 day SMA | 40.85 | 40.8 | 40.75 |
|
|
