IntermTerm BIV full analysis,charts,indicators,moving averages,SMA,DMA,EMA,ADX,MACD,RSIInterm Term BIV WideScreen charts, DMA,SMA,EMA technical analysis, forecast prediction, by indicators ADX,MACD,RSI,CCI AMEX stock exchange
Daily price and charts and targets IntermTerm Strong Daily Stock price targets for IntermTerm BIV are 78.6 and 78.73 | Daily Target 1 | 78.57 | | Daily Target 2 | 78.62 | | Daily Target 3 | 78.7 | | Daily Target 4 | 78.75 | | Daily Target 5 | 78.83 |
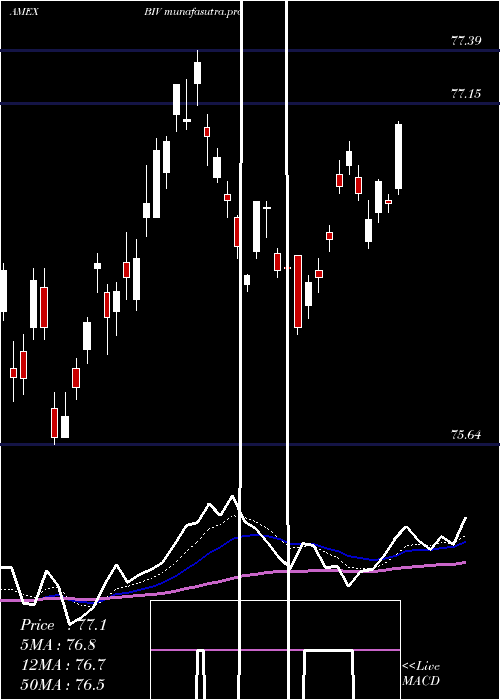
Daily price and volume Interm Term
| Date |
Closing |
Open |
Range |
Volume |
Thu 23 October 2025 |
78.67 (-0.22%) |
78.73 |
78.65 - 78.78 |
0.9957 times |
Wed 22 October 2025 |
78.84 (0.01%) |
78.80 |
78.73 - 78.86 |
1.1025 times |
Tue 21 October 2025 |
78.83 (0.11%) |
78.87 |
78.81 - 78.91 |
0.8735 times |
Mon 20 October 2025 |
78.74 (0.14%) |
78.69 |
78.65 - 78.75 |
0.8684 times |
Fri 17 October 2025 |
78.63 (-0.17%) |
78.98 |
78.56 - 78.98 |
0.9949 times |
Thu 16 October 2025 |
78.76 (0.36%) |
78.45 |
78.15 - 78.77 |
1.408 times |
Wed 15 October 2025 |
78.48 (-0.03%) |
78.55 |
78.42 - 78.62 |
0.977 times |
Tue 14 October 2025 |
78.50 (0.14%) |
78.35 |
78.31 - 78.54 |
0.9971 times |
Mon 13 October 2025 |
78.39 (0.2%) |
78.26 |
78.17 - 78.39 |
0.5963 times |
Fri 10 October 2025 |
78.23 (0.42%) |
78.13 |
78.06 - 78.31 |
1.1865 times |
Thu 09 October 2025 |
77.90 (-0.12%) |
77.94 |
77.87 - 77.95 |
0.8375 times |
Weekly price and charts IntermTerm Strong weekly Stock price targets for IntermTerm BIV are 78.53 and 78.79 | Weekly Target 1 | 78.48 | | Weekly Target 2 | 78.58 | | Weekly Target 3 | 78.743333333333 | | Weekly Target 4 | 78.84 | | Weekly Target 5 | 79 |
Weekly price and volumes for Interm Term
| Date |
Closing |
Open |
Range |
Volume |
Thu 23 October 2025 |
78.67 (0.05%) |
78.69 |
78.65 - 78.91 |
0.8865 times |
Fri 17 October 2025 |
78.63 (0.51%) |
78.26 |
78.15 - 78.98 |
1.1481 times |
Fri 10 October 2025 |
78.23 (0.24%) |
77.80 |
77.80 - 78.31 |
1.0294 times |
Fri 03 October 2025 |
78.04 (0.14%) |
78.00 |
77.96 - 78.48 |
1.5017 times |
Fri 26 September 2025 |
77.93 (-0.41%) |
78.24 |
77.80 - 78.31 |
1.1788 times |
Fri 19 September 2025 |
78.25 (-0.22%) |
78.54 |
78.14 - 78.79 |
1.039 times |
Fri 12 September 2025 |
78.42 (0.2%) |
78.42 |
78.21 - 78.71 |
1.1046 times |
Fri 05 September 2025 |
78.26 (0.59%) |
77.28 |
77.25 - 78.41 |
0.8923 times |
Fri 29 August 2025 |
77.80 (0%) |
77.79 |
77.73 - 77.86 |
0.217 times |
Fri 29 August 2025 |
77.80 (0.27%) |
77.49 |
77.43 - 77.87 |
1.0026 times |
Fri 22 August 2025 |
77.59 (0.47%) |
77.28 |
77.08 - 77.67 |
0.8709 times |

Monthly price and charts IntermTerm Strong monthly Stock price targets for IntermTerm BIV are 78.24 and 79.42 | Monthly Target 1 | 77.3 | | Monthly Target 2 | 77.99 | | Monthly Target 3 | 78.483333333333 | | Monthly Target 4 | 79.17 | | Monthly Target 5 | 79.66 |
Monthly price and volumes Interm Term
| Date |
Closing |
Open |
Range |
Volume |
Thu 23 October 2025 |
78.67 (0.74%) |
78.13 |
77.80 - 78.98 |
0.8355 times |
Tue 30 September 2025 |
78.09 (0.37%) |
77.28 |
77.25 - 78.79 |
1.0143 times |
Fri 29 August 2025 |
77.80 (1.18%) |
77.17 |
77.08 - 77.87 |
1.0443 times |
Thu 31 July 2025 |
76.89 (-0.58%) |
77.05 |
76.13 - 77.11 |
0.9599 times |
Mon 30 June 2025 |
77.34 (1.22%) |
75.98 |
75.64 - 77.39 |
1.184 times |
Fri 30 May 2025 |
76.41 (-0.79%) |
76.86 |
75.28 - 76.92 |
0.9639 times |
Wed 30 April 2025 |
77.02 (0.59%) |
76.44 |
74.44 - 77.71 |
1.3348 times |
Mon 31 March 2025 |
76.57 (-0.03%) |
76.19 |
75.69 - 76.81 |
0.7696 times |
Fri 28 February 2025 |
76.59 (1.86%) |
75.03 |
74.46 - 76.61 |
0.8311 times |
Fri 31 January 2025 |
75.19 (0.62%) |
74.83 |
73.72 - 75.39 |
1.0625 times |
Tue 31 December 2024 |
74.73 (-1.62%) |
76.47 |
74.35 - 76.49 |
0.7973 times |

DMA SMA EMA moving averages of Interm Term BIV
DMA (daily moving average) of Interm Term BIV
| DMA period | DMA value | | 5 day DMA | 78.74 | | 12 day DMA | 78.5 | | 20 day DMA | 78.31 | | 35 day DMA | 78.32 | | 50 day DMA | 78.09 | | 100 day DMA | 77.39 | | 150 day DMA | 76.96 | | 200 day DMA | 76.56 | EMA (exponential moving average) of Interm Term BIV
| EMA period | EMA current | EMA prev | EMA prev2 | | 5 day EMA | 78.71 | 78.73 | 78.68 | | 12 day EMA | 78.56 | 78.54 | 78.48 | | 20 day EMA | 78.43 | 78.41 | 78.36 | | 35 day EMA | 78.25 | 78.22 | 78.18 | | 50 day EMA | 78.08 | 78.06 | 78.03 |
SMA (simple moving average) of Interm Term BIV
| SMA period | SMA current | SMA prev | SMA prev2 | | 5 day SMA | 78.74 | 78.76 | 78.69 | | 12 day SMA | 78.5 | 78.44 | 78.36 | | 20 day SMA | 78.31 | 78.28 | 78.24 | | 35 day SMA | 78.32 | 78.3 | 78.26 | | 50 day SMA | 78.09 | 78.06 | 78.03 | | 100 day SMA | 77.39 | 77.37 | 77.34 | | 150 day SMA | 76.96 | 76.94 | 76.93 | | 200 day SMA | 76.56 | 76.53 | 76.51 |
|
|
