BirksGroup BGI full analysis,charts,indicators,moving averages,SMA,DMA,EMA,ADX,MACD,RSIBirks Group BGI WideScreen charts, DMA,SMA,EMA technical analysis, forecast prediction, by indicators ADX,MACD,RSI,CCI AMEX stock exchange
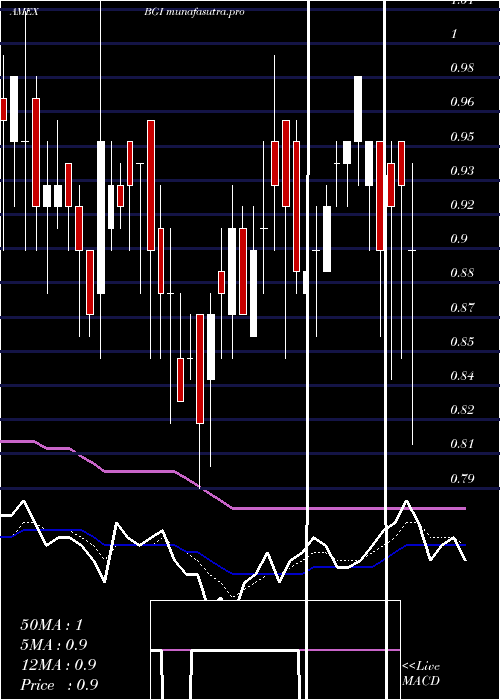
Daily price and charts and targets BirksGroup Strong Daily Stock price targets for BirksGroup BGI are 1.14 and 1.2 | Daily Target 1 | 1.12 | | Daily Target 2 | 1.16 | | Daily Target 3 | 1.1833333333333 | | Daily Target 4 | 1.22 | | Daily Target 5 | 1.24 |
Daily price and volume Birks Group
| Date |
Closing |
Open |
Range |
Volume |
Fri 24 October 2025 |
1.19 (4.39%) |
1.20 |
1.15 - 1.21 |
1.0293 times |
Thu 23 October 2025 |
1.14 (-4.2%) |
1.20 |
1.14 - 1.21 |
0.9474 times |
Wed 22 October 2025 |
1.19 (0.85%) |
1.10 |
1.10 - 1.21 |
1.4039 times |
Tue 21 October 2025 |
1.18 (0%) |
1.14 |
1.14 - 1.19 |
0.6163 times |
Mon 20 October 2025 |
1.18 (2.61%) |
1.13 |
1.13 - 1.19 |
0.8747 times |
Fri 17 October 2025 |
1.15 (-2.54%) |
1.15 |
1.13 - 1.20 |
1.4338 times |
Thu 16 October 2025 |
1.18 (6.31%) |
1.11 |
1.09 - 1.18 |
0.9736 times |
Wed 15 October 2025 |
1.11 (-1.77%) |
1.10 |
1.10 - 1.14 |
0.8774 times |
Tue 14 October 2025 |
1.13 (4.63%) |
1.06 |
1.06 - 1.15 |
1.2883 times |
Mon 13 October 2025 |
1.08 (-3.57%) |
1.14 |
1.07 - 1.16 |
0.5554 times |
Fri 10 October 2025 |
1.12 (-3.45%) |
1.13 |
1.12 - 1.18 |
2.0491 times |
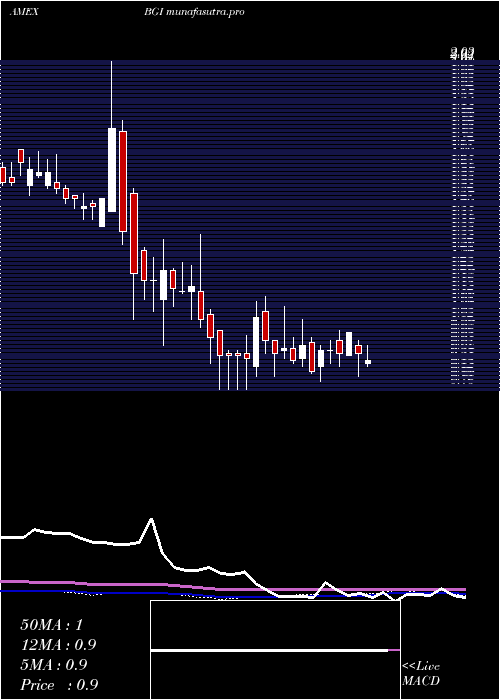
Weekly price and charts BirksGroup Strong weekly Stock price targets for BirksGroup BGI are 1.15 and 1.26 | Weekly Target 1 | 1.06 | | Weekly Target 2 | 1.12 | | Weekly Target 3 | 1.1666666666667 | | Weekly Target 4 | 1.23 | | Weekly Target 5 | 1.28 |
Weekly price and volumes for Birks Group
| Date |
Closing |
Open |
Range |
Volume |
Fri 24 October 2025 |
1.19 (3.48%) |
1.13 |
1.10 - 1.21 |
0.0399 times |
Fri 17 October 2025 |
1.15 (2.68%) |
1.14 |
1.06 - 1.20 |
0.042 times |
Fri 10 October 2025 |
1.12 (-5.88%) |
1.19 |
1.08 - 1.22 |
0.0564 times |
Fri 03 October 2025 |
1.19 (2.59%) |
1.13 |
1.00 - 1.24 |
0.0771 times |
Fri 26 September 2025 |
1.16 (-6.45%) |
1.22 |
1.06 - 1.40 |
0.2232 times |
Fri 19 September 2025 |
1.24 (47.62%) |
0.86 |
0.82 - 1.57 |
9.0335 times |
Fri 12 September 2025 |
0.84 (-2.33%) |
0.90 |
0.76 - 0.97 |
0.0835 times |
Fri 05 September 2025 |
0.86 (4.88%) |
0.83 |
0.75 - 0.86 |
0.0543 times |
Fri 29 August 2025 |
0.82 (0%) |
0.81 |
0.75 - 0.86 |
0.0428 times |
Fri 29 August 2025 |
0.82 (20.59%) |
0.70 |
0.66 - 1.07 |
0.3474 times |
Fri 22 August 2025 |
0.68 (-1.45%) |
0.71 |
0.64 - 0.74 |
0.0402 times |
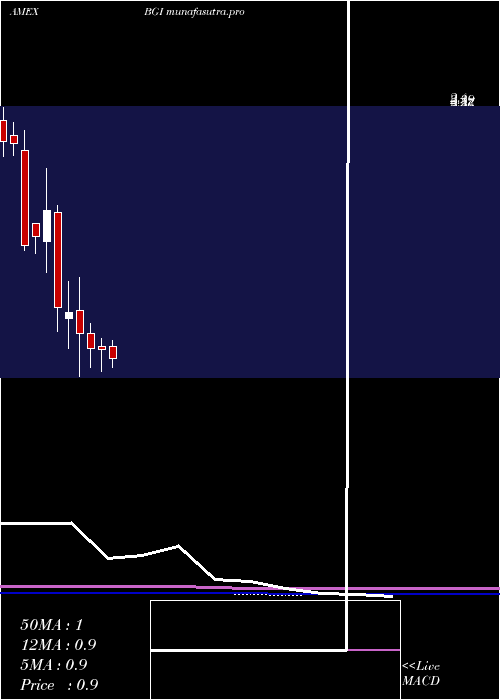
Monthly price and charts BirksGroup Strong monthly Stock price targets for BirksGroup BGI are 1.1 and 1.34 | Monthly Target 1 | 0.9 | | Monthly Target 2 | 1.05 | | Monthly Target 3 | 1.1433333333333 | | Monthly Target 4 | 1.29 | | Monthly Target 5 | 1.38 |
Monthly price and volumes Birks Group
| Date |
Closing |
Open |
Range |
Volume |
Fri 24 October 2025 |
1.19 (8.18%) |
1.14 |
1.00 - 1.24 |
0.1542 times |
Tue 30 September 2025 |
1.10 (34.15%) |
0.83 |
0.75 - 1.57 |
7.2145 times |
Fri 29 August 2025 |
0.82 (13.89%) |
0.72 |
0.56 - 1.07 |
0.6128 times |
Thu 31 July 2025 |
0.72 (-21.74%) |
0.94 |
0.71 - 0.98 |
0.1924 times |
Mon 30 June 2025 |
0.92 (-1.08%) |
0.94 |
0.79 - 0.99 |
0.1755 times |
Fri 30 May 2025 |
0.93 (-8.82%) |
1.02 |
0.81 - 1.08 |
0.1311 times |
Wed 30 April 2025 |
1.02 (-11.3%) |
1.16 |
0.76 - 1.36 |
0.2509 times |
Mon 31 March 2025 |
1.15 (-2.54%) |
1.11 |
0.93 - 1.34 |
0.2016 times |
Fri 28 February 2025 |
1.18 (-33.33%) |
1.76 |
1.03 - 1.80 |
0.7186 times |
Fri 31 January 2025 |
1.77 (9.94%) |
1.58 |
1.39 - 2.03 |
0.3484 times |
Tue 31 December 2024 |
1.61 (3.21%) |
1.69 |
1.51 - 1.69 |
0.0157 times |
DMA SMA EMA moving averages of Birks Group BGI
DMA (daily moving average) of Birks Group BGI
| DMA period | DMA value | | 5 day DMA | 1.18 | | 12 day DMA | 1.15 | | 20 day DMA | 1.15 | | 35 day DMA | 1.11 | | 50 day DMA | 1 | | 100 day DMA | 0.92 | | 150 day DMA | 0.94 | | 200 day DMA | 1.04 | EMA (exponential moving average) of Birks Group BGI
| EMA period | EMA current | EMA prev | EMA prev2 | | 5 day EMA | 1.17 | 1.16 | 1.17 | | 12 day EMA | 1.16 | 1.16 | 1.16 | | 20 day EMA | 1.14 | 1.14 | 1.14 | | 35 day EMA | 1.08 | 1.07 | 1.07 | | 50 day EMA | 1 | 0.99 | 0.98 |
SMA (simple moving average) of Birks Group BGI
| SMA period | SMA current | SMA prev | SMA prev2 | | 5 day SMA | 1.18 | 1.17 | 1.18 | | 12 day SMA | 1.15 | 1.14 | 1.15 | | 20 day SMA | 1.15 | 1.15 | 1.15 | | 35 day SMA | 1.11 | 1.1 | 1.09 | | 50 day SMA | 1 | 0.99 | 0.98 | | 100 day SMA | 0.92 | 0.92 | 0.92 | | 150 day SMA | 0.94 | 0.94 | 0.94 | | 200 day SMA | 1.04 | 1.04 | 1.04 |
|
|
