FlaniganS BDL full analysis,charts,indicators,moving averages,SMA,DMA,EMA,ADX,MACD,RSIFlanigan S BDL WideScreen charts, DMA,SMA,EMA technical analysis, forecast prediction, by indicators ADX,MACD,RSI,CCI AMEX stock exchange
Daily price and charts and targets FlaniganS Strong Daily Stock price targets for FlaniganS BDL are 30.05 and 31.95 | Daily Target 1 | 29.73 | | Daily Target 2 | 30.37 | | Daily Target 3 | 31.633333333333 | | Daily Target 4 | 32.27 | | Daily Target 5 | 33.53 |
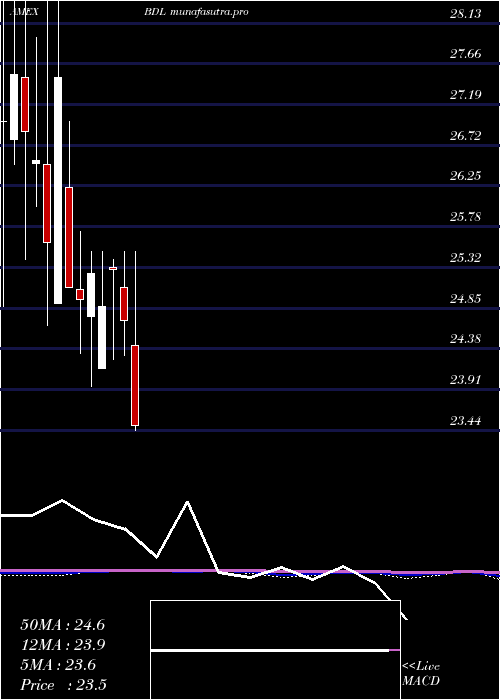
Daily price and volume Flanigan S
| Date |
Closing |
Open |
Range |
Volume |
Thu 23 October 2025 |
31.00 (-3.55%) |
32.90 |
31.00 - 32.90 |
7.6932 times |
Tue 21 October 2025 |
32.14 (0.91%) |
33.70 |
32.14 - 33.70 |
0.112 times |
Fri 17 October 2025 |
31.85 (-5.26%) |
31.50 |
30.23 - 31.85 |
0.2352 times |
Wed 15 October 2025 |
33.62 (5.26%) |
32.62 |
32.62 - 33.62 |
0.308 times |
Tue 14 October 2025 |
31.94 (1.85%) |
32.25 |
30.75 - 32.25 |
0.6439 times |
Mon 13 October 2025 |
31.36 (0.51%) |
30.46 |
30.46 - 31.36 |
0.308 times |
Fri 10 October 2025 |
31.20 (-0.79%) |
31.20 |
31.20 - 31.20 |
0.056 times |
Thu 09 October 2025 |
31.45 (1.52%) |
31.45 |
31.45 - 31.45 |
0.168 times |
Tue 07 October 2025 |
30.98 (-3.19%) |
30.27 |
29.00 - 31.40 |
0.4479 times |
Mon 06 October 2025 |
32.00 (-0.74%) |
32.00 |
32.00 - 32.00 |
0.028 times |
Fri 03 October 2025 |
32.24 (6.9%) |
32.24 |
32.24 - 32.24 |
0.0554 times |

Weekly price and charts FlaniganS Strong weekly Stock price targets for FlaniganS BDL are 29.65 and 32.35 | Weekly Target 1 | 29.2 | | Weekly Target 2 | 30.1 | | Weekly Target 3 | 31.9 | | Weekly Target 4 | 32.8 | | Weekly Target 5 | 34.6 |
Weekly price and volumes for Flanigan S
| Date |
Closing |
Open |
Range |
Volume |
Thu 23 October 2025 |
31.00 (-2.67%) |
33.70 |
31.00 - 33.70 |
3.3762 times |
Fri 17 October 2025 |
31.85 (2.08%) |
30.46 |
30.23 - 33.62 |
0.6467 times |
Fri 10 October 2025 |
31.20 (-3.23%) |
32.00 |
29.00 - 32.00 |
0.3027 times |
Fri 03 October 2025 |
32.24 (8.01%) |
32.45 |
30.08 - 32.45 |
0.9151 times |
Fri 26 September 2025 |
29.85 (-5.92%) |
31.00 |
29.25 - 31.00 |
0.4117 times |
Fri 19 September 2025 |
31.73 (15.38%) |
26.58 |
26.33 - 31.73 |
1.6591 times |
Fri 12 September 2025 |
27.50 (-11.32%) |
28.80 |
26.63 - 28.80 |
0.9688 times |
Thu 04 September 2025 |
31.01 (6.78%) |
29.05 |
28.38 - 31.01 |
0.2422 times |
Fri 29 August 2025 |
29.04 (0%) |
29.25 |
28.45 - 29.25 |
0.3754 times |
Fri 29 August 2025 |
29.04 (-6.32%) |
30.44 |
28.45 - 30.50 |
1.102 times |
Fri 22 August 2025 |
31.00 (0.65%) |
30.90 |
30.80 - 31.76 |
0.1695 times |

Monthly price and charts FlaniganS Strong monthly Stock price targets for FlaniganS BDL are 27.65 and 32.35 | Monthly Target 1 | 26.53 | | Monthly Target 2 | 28.77 | | Monthly Target 3 | 31.233333333333 | | Monthly Target 4 | 33.47 | | Monthly Target 5 | 35.93 |
Monthly price and volumes Flanigan S
| Date |
Closing |
Open |
Range |
Volume |
Thu 23 October 2025 |
31.00 (-2.76%) |
31.88 |
29.00 - 33.70 |
0.9776 times |
Tue 30 September 2025 |
31.88 (9.78%) |
29.05 |
26.33 - 32.45 |
0.752 times |
Fri 29 August 2025 |
29.04 (-9.25%) |
30.40 |
28.45 - 33.41 |
0.5505 times |
Thu 31 July 2025 |
32.00 (-7.83%) |
32.01 |
29.00 - 34.70 |
0.4515 times |
Mon 30 June 2025 |
34.72 (26.9%) |
28.09 |
28.09 - 35.98 |
1.5704 times |
Fri 30 May 2025 |
27.36 (11.67%) |
24.16 |
22.61 - 28.50 |
1.7966 times |
Wed 30 April 2025 |
24.50 (-0.85%) |
24.42 |
23.22 - 25.50 |
0.6381 times |
Mon 31 March 2025 |
24.71 (-2.29%) |
25.09 |
24.30 - 25.50 |
0.8721 times |
Wed 26 February 2025 |
25.29 (1.69%) |
25.31 |
24.25 - 25.40 |
0.4301 times |
Fri 31 January 2025 |
24.87 (-1.5%) |
24.15 |
24.15 - 25.50 |
1.9611 times |
Tue 31 December 2024 |
25.25 (1.24%) |
24.75 |
23.94 - 25.50 |
1.0923 times |
DMA SMA EMA moving averages of Flanigan S BDL
DMA (daily moving average) of Flanigan S BDL
| DMA period | DMA value | | 5 day DMA | 32.11 | | 12 day DMA | 31.66 | | 20 day DMA | 31.19 | | 35 day DMA | 30.08 | | 50 day DMA | 30.59 | | 100 day DMA | 29.64 | | 150 day DMA | 28.03 | | 200 day DMA | 27.31 | EMA (exponential moving average) of Flanigan S BDL
| EMA period | EMA current | EMA prev | EMA prev2 | | 5 day EMA | 31.74 | 32.11 | 32.09 | | 12 day EMA | 31.52 | 31.62 | 31.53 | | 20 day EMA | 31.18 | 31.2 | 31.1 | | 35 day EMA | 31.14 | 31.15 | 31.09 | | 50 day EMA | 30.97 | 30.97 | 30.92 |
SMA (simple moving average) of Flanigan S BDL
| SMA period | SMA current | SMA prev | SMA prev2 | | 5 day SMA | 32.11 | 32.18 | 31.99 | | 12 day SMA | 31.66 | 31.63 | 31.61 | | 20 day SMA | 31.19 | 30.99 | 30.72 | | 35 day SMA | 30.08 | 30.08 | 30.07 | | 50 day SMA | 30.59 | 30.63 | 30.64 | | 100 day SMA | 29.64 | 29.56 | 29.48 | | 150 day SMA | 28.03 | 27.99 | 27.93 | | 200 day SMA | 27.31 | 27.28 | 27.25 |
|
|
