JpmorganBetabuilders BBSC full analysis,charts,indicators,moving averages,SMA,DMA,EMA,ADX,MACD,RSIJpmorgan Betabuilders BBSC WideScreen charts, DMA,SMA,EMA technical analysis, forecast prediction, by indicators ADX,MACD,RSI,CCI AMEX stock exchange
Daily price and charts and targets JpmorganBetabuilders Strong Daily Stock price targets for JpmorganBetabuilders BBSC are 75.02 and 75.3 | Daily Target 1 | 74.79 | | Daily Target 2 | 74.97 | | Daily Target 3 | 75.066666666667 | | Daily Target 4 | 75.25 | | Daily Target 5 | 75.35 |
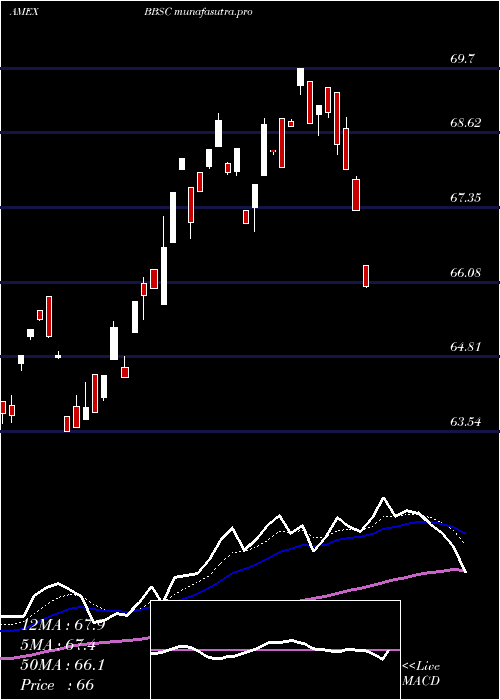
Daily price and volume Jpmorgan Betabuilders
| Date |
Closing |
Open |
Range |
Volume |
Thu 23 October 2025 |
75.16 (1.16%) |
74.88 |
74.88 - 75.16 |
0.3989 times |
Wed 22 October 2025 |
74.30 (-1.72%) |
75.19 |
74.05 - 75.19 |
0.6415 times |
Tue 21 October 2025 |
75.60 (-0.25%) |
76.00 |
75.60 - 76.00 |
0.7697 times |
Mon 20 October 2025 |
75.79 (1.73%) |
75.49 |
75.49 - 75.79 |
4.6865 times |
Fri 17 October 2025 |
74.50 (-0.52%) |
74.39 |
74.39 - 74.50 |
0.081 times |
Thu 16 October 2025 |
74.89 (-2.05%) |
76.62 |
74.89 - 76.62 |
0.5292 times |
Wed 15 October 2025 |
76.46 (0.7%) |
76.81 |
76.31 - 77.22 |
0.637 times |
Tue 14 October 2025 |
75.93 (1.62%) |
73.50 |
73.50 - 76.14 |
0.3981 times |
Mon 13 October 2025 |
74.72 (2.86%) |
74.41 |
74.34 - 74.72 |
1.1944 times |
Fri 10 October 2025 |
72.64 (-2.98%) |
75.20 |
72.64 - 75.20 |
0.6636 times |
Thu 09 October 2025 |
74.87 (-0.78%) |
75.26 |
74.70 - 75.26 |
0.3185 times |
Weekly price and charts JpmorganBetabuilders Strong weekly Stock price targets for JpmorganBetabuilders BBSC are 73.63 and 75.58 | Weekly Target 1 | 73.12 | | Weekly Target 2 | 74.14 | | Weekly Target 3 | 75.07 | | Weekly Target 4 | 76.09 | | Weekly Target 5 | 77.02 |
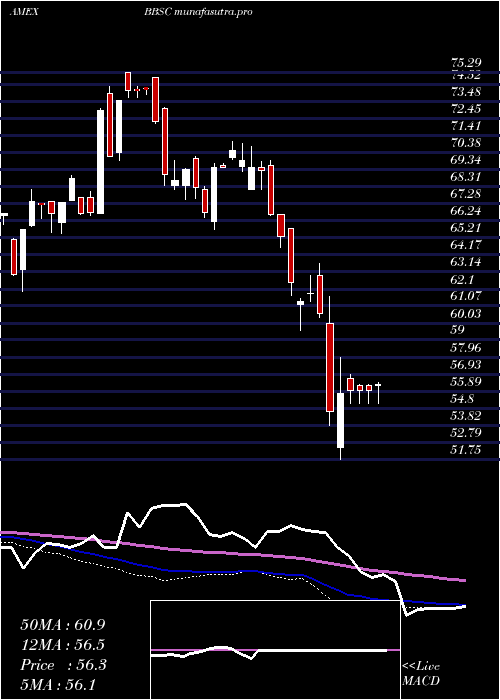
Weekly price and volumes for Jpmorgan Betabuilders
| Date |
Closing |
Open |
Range |
Volume |
Thu 23 October 2025 |
75.16 (0.89%) |
75.49 |
74.05 - 76.00 |
0.3022 times |
Fri 17 October 2025 |
74.50 (2.56%) |
74.41 |
73.50 - 77.22 |
0.1321 times |
Fri 10 October 2025 |
72.64 (-3.83%) |
76.05 |
72.64 - 76.05 |
0.1031 times |
Fri 03 October 2025 |
75.53 (1.92%) |
74.66 |
73.56 - 75.90 |
1.019 times |
Fri 26 September 2025 |
74.11 (-1%) |
74.67 |
72.95 - 75.73 |
0.5692 times |
Fri 19 September 2025 |
74.86 (2.23%) |
73.52 |
73.08 - 75.41 |
0.5395 times |
Fri 12 September 2025 |
73.23 (0.07%) |
73.51 |
72.43 - 73.95 |
0.0877 times |
Fri 05 September 2025 |
73.18 (0.87%) |
71.79 |
71.68 - 73.49 |
0.237 times |
Fri 29 August 2025 |
72.55 (0%) |
72.87 |
72.36 - 72.87 |
3.4681 times |
Fri 29 August 2025 |
72.55 (0.3%) |
72.07 |
71.67 - 72.87 |
3.5421 times |
Fri 22 August 2025 |
72.33 (3.42%) |
70.16 |
69.21 - 72.46 |
0.1617 times |
Monthly price and charts JpmorganBetabuilders Strong monthly Stock price targets for JpmorganBetabuilders BBSC are 73.9 and 78.48 | Monthly Target 1 | 70.43 | | Monthly Target 2 | 72.79 | | Monthly Target 3 | 75.006666666667 | | Monthly Target 4 | 77.37 | | Monthly Target 5 | 79.59 |
Monthly price and volumes Jpmorgan Betabuilders
| Date |
Closing |
Open |
Range |
Volume |
Thu 23 October 2025 |
75.16 (1.38%) |
74.39 |
72.64 - 77.22 |
0.1632 times |
Tue 30 September 2025 |
74.14 (2.19%) |
71.79 |
71.68 - 75.73 |
0.5679 times |
Fri 29 August 2025 |
72.55 (7.8%) |
66.36 |
65.99 - 72.87 |
1.8584 times |
Thu 31 July 2025 |
67.30 (2%) |
65.70 |
65.70 - 69.70 |
0.4788 times |
Mon 30 June 2025 |
65.98 (5.05%) |
62.92 |
62.12 - 66.30 |
0.8959 times |
Fri 30 May 2025 |
62.81 (6.49%) |
59.68 |
59.26 - 64.26 |
0.9143 times |
Wed 30 April 2025 |
58.98 (-2.54%) |
60.71 |
51.75 - 61.62 |
1.5791 times |
Mon 31 March 2025 |
60.52 (-7.29%) |
65.75 |
59.56 - 65.75 |
1.3782 times |
Fri 28 February 2025 |
65.28 (-6.6%) |
68.17 |
64.60 - 70.74 |
1.7467 times |
Fri 31 January 2025 |
69.89 (2.6%) |
68.81 |
65.73 - 71.08 |
0.4174 times |
Tue 31 December 2024 |
68.12 (-8.18%) |
74.31 |
67.55 - 74.94 |
2.1742 times |

DMA SMA EMA moving averages of Jpmorgan Betabuilders BBSC
DMA (daily moving average) of Jpmorgan Betabuilders BBSC
| DMA period | DMA value | | 5 day DMA | 75.07 | | 12 day DMA | 75.03 | | 20 day DMA | 74.9 | | 35 day DMA | 74.45 | | 50 day DMA | 73.57 | | 100 day DMA | 70.2 | | 150 day DMA | 66.72 | | 200 day DMA | 66.77 | EMA (exponential moving average) of Jpmorgan Betabuilders BBSC
| EMA period | EMA current | EMA prev | EMA prev2 | | 5 day EMA | 75.06 | 75.01 | 75.37 | | 12 day EMA | 75.02 | 75 | 75.13 | | 20 day EMA | 74.78 | 74.74 | 74.79 | | 35 day EMA | 74.09 | 74.03 | 74.01 | | 50 day EMA | 73.36 | 73.29 | 73.25 |
SMA (simple moving average) of Jpmorgan Betabuilders BBSC
| SMA period | SMA current | SMA prev | SMA prev2 | | 5 day SMA | 75.07 | 75.02 | 75.45 | | 12 day SMA | 75.03 | 75 | 75.1 | | 20 day SMA | 74.9 | 74.81 | 74.8 | | 35 day SMA | 74.45 | 74.38 | 74.31 | | 50 day SMA | 73.57 | 73.47 | 73.41 | | 100 day SMA | 70.2 | 70.08 | 69.97 | | 150 day SMA | 66.72 | 66.63 | 66.55 | | 200 day SMA | 66.77 | 66.74 | 66.72 |
|
|
