BiosharesBiotech BBP full analysis,charts,indicators,moving averages,SMA,DMA,EMA,ADX,MACD,RSIBioshares Biotech BBP WideScreen charts, DMA,SMA,EMA technical analysis, forecast prediction, by indicators ADX,MACD,RSI,CCI AMEX stock exchange
Daily price and charts and targets BiosharesBiotech Strong Daily Stock price targets for BiosharesBiotech BBP are 72.18 and 72.78 | Daily Target 1 | 72.05 | | Daily Target 2 | 72.3 | | Daily Target 3 | 72.65 | | Daily Target 4 | 72.9 | | Daily Target 5 | 73.25 |
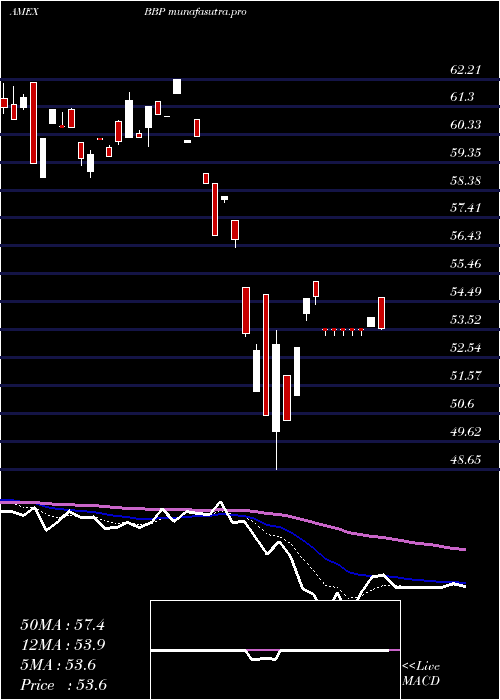
Daily price and volume Bioshares Biotech
| Date |
Closing |
Open |
Range |
Volume |
Fri 24 October 2025 |
72.55 (0.51%) |
73.00 |
72.40 - 73.00 |
0.906 times |
Thu 23 October 2025 |
72.18 (0.66%) |
72.70 |
71.65 - 72.70 |
0.2662 times |
Wed 22 October 2025 |
71.71 (-1.61%) |
73.74 |
71.71 - 73.74 |
0.5309 times |
Tue 21 October 2025 |
72.88 (-0.69%) |
73.04 |
72.82 - 73.27 |
1.1575 times |
Mon 20 October 2025 |
73.39 (1.86%) |
72.67 |
72.67 - 73.68 |
1.0964 times |
Fri 17 October 2025 |
72.05 (-0.12%) |
71.98 |
71.74 - 72.23 |
0.7981 times |
Thu 16 October 2025 |
72.14 (-0.93%) |
72.97 |
71.89 - 72.97 |
1.1412 times |
Wed 15 October 2025 |
72.82 (2.55%) |
71.66 |
71.66 - 72.97 |
2.5254 times |
Tue 14 October 2025 |
71.01 (0.06%) |
70.30 |
70.30 - 71.24 |
0.4209 times |
Mon 13 October 2025 |
70.97 (0.24%) |
70.85 |
70.66 - 71.15 |
1.1575 times |
Fri 10 October 2025 |
70.80 (-1.87%) |
72.04 |
70.27 - 72.04 |
6.1556 times |
Weekly price and charts BiosharesBiotech Strong weekly Stock price targets for BiosharesBiotech BBP are 71.06 and 73.15 | Weekly Target 1 | 70.56 | | Weekly Target 2 | 71.55 | | Weekly Target 3 | 72.646666666667 | | Weekly Target 4 | 73.64 | | Weekly Target 5 | 74.74 |
Weekly price and volumes for Bioshares Biotech
| Date |
Closing |
Open |
Range |
Volume |
Fri 24 October 2025 |
72.55 (0.69%) |
72.67 |
71.65 - 73.74 |
0.466 times |
Fri 17 October 2025 |
72.05 (1.77%) |
70.85 |
70.30 - 72.97 |
0.7117 times |
Fri 10 October 2025 |
70.80 (-1.54%) |
72.15 |
70.27 - 72.69 |
2.1407 times |
Fri 03 October 2025 |
71.91 (4.49%) |
68.69 |
68.69 - 72.24 |
2.9575 times |
Fri 26 September 2025 |
68.82 (-1.19%) |
68.94 |
68.05 - 70.69 |
0.8241 times |
Fri 19 September 2025 |
69.65 (0.69%) |
69.20 |
68.60 - 70.42 |
0.4152 times |
Fri 12 September 2025 |
69.17 (-1.62%) |
70.61 |
69.17 - 70.61 |
0.7374 times |
Fri 05 September 2025 |
70.31 (4.44%) |
68.16 |
68.16 - 70.59 |
0.6134 times |
Fri 29 August 2025 |
67.32 (0%) |
68.21 |
67.06 - 68.21 |
0.1177 times |
Fri 29 August 2025 |
67.32 (-1.15%) |
68.21 |
66.55 - 68.21 |
1.0162 times |
Fri 22 August 2025 |
68.10 (0.9%) |
67.67 |
66.63 - 68.36 |
0.3904 times |

Monthly price and charts BiosharesBiotech Strong monthly Stock price targets for BiosharesBiotech BBP are 71.41 and 74.88 | Monthly Target 1 | 68.72 | | Monthly Target 2 | 70.63 | | Monthly Target 3 | 72.186666666667 | | Monthly Target 4 | 74.1 | | Monthly Target 5 | 75.66 |
Monthly price and volumes Bioshares Biotech
| Date |
Closing |
Open |
Range |
Volume |
Fri 24 October 2025 |
72.55 (3.69%) |
70.30 |
70.27 - 73.74 |
1.7145 times |
Tue 30 September 2025 |
69.97 (3.94%) |
68.16 |
68.05 - 70.69 |
0.779 times |
Fri 29 August 2025 |
67.32 (9.41%) |
60.91 |
60.91 - 68.36 |
0.5977 times |
Thu 31 July 2025 |
61.53 (5.67%) |
58.27 |
58.21 - 64.15 |
0.7768 times |
Mon 30 June 2025 |
58.23 (3.8%) |
57.52 |
57.42 - 61.29 |
1.4551 times |
Fri 30 May 2025 |
56.10 (-4.74%) |
58.86 |
53.12 - 59.00 |
0.8417 times |
Wed 30 April 2025 |
58.89 (0.46%) |
58.59 |
48.65 - 58.89 |
1.1924 times |
Mon 31 March 2025 |
58.62 (-4.82%) |
62.12 |
58.62 - 62.21 |
0.7439 times |
Fri 28 February 2025 |
61.59 (-1.2%) |
61.09 |
60.82 - 63.90 |
1.3767 times |
Fri 31 January 2025 |
62.34 (3.87%) |
61.03 |
58.81 - 63.85 |
0.5223 times |
Tue 31 December 2024 |
60.02 (-7.68%) |
65.61 |
59.50 - 65.70 |
0.5076 times |

DMA SMA EMA moving averages of Bioshares Biotech BBP
DMA (daily moving average) of Bioshares Biotech BBP
| DMA period | DMA value | | 5 day DMA | 72.54 | | 12 day DMA | 72.05 | | 20 day DMA | 71.68 | | 35 day DMA | 70.75 | | 50 day DMA | 69.89 | | 100 day DMA | 65.55 | | 150 day DMA | 62.23 | | 200 day DMA | 62.04 | EMA (exponential moving average) of Bioshares Biotech BBP
| EMA period | EMA current | EMA prev | EMA prev2 | | 5 day EMA | 72.35 | 72.25 | 72.28 | | 12 day EMA | 72.05 | 71.96 | 71.92 | | 20 day EMA | 71.61 | 71.51 | 71.44 | | 35 day EMA | 70.73 | 70.62 | 70.53 | | 50 day EMA | 69.8 | 69.69 | 69.59 |
SMA (simple moving average) of Bioshares Biotech BBP
| SMA period | SMA current | SMA prev | SMA prev2 | | 5 day SMA | 72.54 | 72.44 | 72.43 | | 12 day SMA | 72.05 | 72.02 | 71.98 | | 20 day SMA | 71.68 | 71.5 | 71.29 | | 35 day SMA | 70.75 | 70.68 | 70.6 | | 50 day SMA | 69.89 | 69.79 | 69.68 | | 100 day SMA | 65.55 | 65.4 | 65.24 | | 150 day SMA | 62.23 | 62.16 | 62.08 | | 200 day SMA | 62.04 | 61.98 | 61.92 |
|
|
