JpmorganBetabuilders BBMC full analysis,charts,indicators,moving averages,SMA,DMA,EMA,ADX,MACD,RSIJpmorgan Betabuilders BBMC WideScreen charts, DMA,SMA,EMA technical analysis, forecast prediction, by indicators ADX,MACD,RSI,CCI AMEX stock exchange
Daily price and charts and targets JpmorganBetabuilders Strong Daily Stock price targets for JpmorganBetabuilders BBMC are 105.69 and 105.69 | Daily Target 1 | 105.56 | | Daily Target 2 | 105.56 | | Daily Target 3 | 105.80666666667 | | Daily Target 4 | 105.81 | | Daily Target 5 | 105.81 |
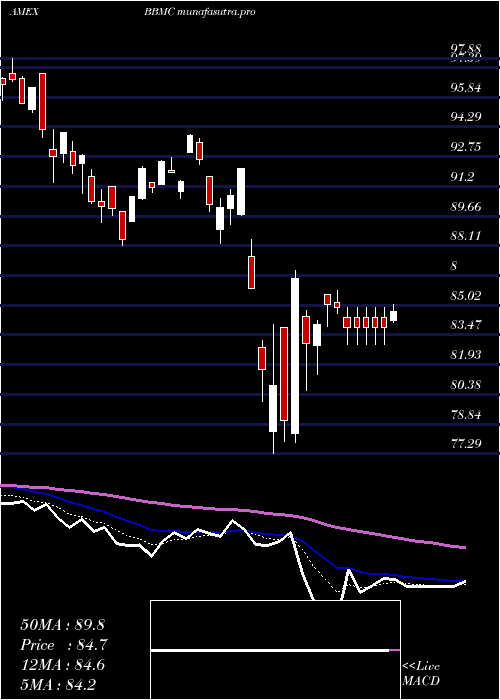
Daily price and volume Jpmorgan Betabuilders
| Date |
Closing |
Open |
Range |
Volume |
Fri 24 October 2025 |
105.32 (0%) |
106.05 |
106.05 - 106.05 |
0 times |
Thu 23 October 2025 |
105.32 (1.39%) |
104.62 |
104.62 - 105.39 |
1.0759 times |
Wed 22 October 2025 |
103.88 (-1.27%) |
105.16 |
103.32 - 105.16 |
1.6492 times |
Tue 21 October 2025 |
105.22 (0.3%) |
104.84 |
104.84 - 105.57 |
3.2023 times |
Mon 20 October 2025 |
104.91 (1.24%) |
104.90 |
104.52 - 104.94 |
0.2846 times |
Fri 17 October 2025 |
103.63 (0.14%) |
103.38 |
103.38 - 103.73 |
0.1033 times |
Thu 16 October 2025 |
103.48 (-1.17%) |
104.66 |
103.22 - 104.66 |
0.2758 times |
Wed 15 October 2025 |
104.71 (0.32%) |
105.37 |
104.03 - 105.71 |
1.2396 times |
Tue 14 October 2025 |
104.38 (0.69%) |
102.35 |
102.35 - 104.82 |
0.6198 times |
Mon 13 October 2025 |
103.66 (2.05%) |
102.90 |
102.90 - 103.82 |
1.5495 times |
Fri 10 October 2025 |
101.58 (-3.04%) |
104.98 |
101.58 - 104.98 |
1.3429 times |
Weekly price and charts JpmorganBetabuilders Strong weekly Stock price targets for JpmorganBetabuilders BBMC are 104.32 and 107.05 | Weekly Target 1 | 102.17 | | Weekly Target 2 | 103.74 | | Weekly Target 3 | 104.89666666667 | | Weekly Target 4 | 106.47 | | Weekly Target 5 | 107.63 |
Weekly price and volumes for Jpmorgan Betabuilders
| Date |
Closing |
Open |
Range |
Volume |
Fri 24 October 2025 |
105.32 (1.63%) |
104.90 |
103.32 - 106.05 |
0.1317 times |
Fri 17 October 2025 |
103.63 (2.02%) |
102.90 |
102.35 - 105.71 |
0.0803 times |
Fri 10 October 2025 |
101.58 (-3.41%) |
105.99 |
101.58 - 105.99 |
0.119 times |
Fri 03 October 2025 |
105.17 (1.14%) |
104.67 |
103.14 - 105.42 |
2.7249 times |
Fri 26 September 2025 |
103.98 (-1.58%) |
105.24 |
102.74 - 105.96 |
0.1982 times |
Fri 19 September 2025 |
105.65 (0.53%) |
105.45 |
104.28 - 106.41 |
0.1741 times |
Fri 12 September 2025 |
105.09 (0.22%) |
105.09 |
103.93 - 105.99 |
0.1511 times |
Fri 05 September 2025 |
104.86 (1.32%) |
102.34 |
102.17 - 105.40 |
1.0829 times |
Fri 29 August 2025 |
103.49 (0%) |
103.52 |
103.18 - 103.52 |
2.5917 times |
Fri 29 August 2025 |
103.49 (0.13%) |
103.01 |
102.68 - 104.09 |
2.7461 times |
Fri 22 August 2025 |
103.36 (2.39%) |
101.18 |
99.82 - 103.65 |
0.1336 times |

Monthly price and charts JpmorganBetabuilders Strong monthly Stock price targets for JpmorganBetabuilders BBMC are 103.45 and 107.92 | Monthly Target 1 | 99.85 | | Monthly Target 2 | 102.58 | | Monthly Target 3 | 104.31666666667 | | Monthly Target 4 | 107.05 | | Monthly Target 5 | 108.79 |
Monthly price and volumes Jpmorgan Betabuilders
| Date |
Closing |
Open |
Range |
Volume |
Fri 24 October 2025 |
105.32 (1.27%) |
104.18 |
101.58 - 106.05 |
0.0391 times |
Tue 30 September 2025 |
104.00 (0.49%) |
102.34 |
102.17 - 106.41 |
0.4834 times |
Fri 29 August 2025 |
103.49 (4.32%) |
98.02 |
96.88 - 104.09 |
0.6603 times |
Thu 31 July 2025 |
99.20 (1.8%) |
97.10 |
97.10 - 101.16 |
0.105 times |
Mon 30 June 2025 |
97.45 (4.39%) |
93.04 |
92.16 - 97.65 |
0.1437 times |
Fri 30 May 2025 |
93.35 (5.62%) |
88.68 |
88.65 - 95.83 |
0.2741 times |
Wed 30 April 2025 |
88.38 (-1.93%) |
90.07 |
77.29 - 92.13 |
3.9067 times |
Mon 31 March 2025 |
90.12 (-6.49%) |
97.06 |
88.15 - 97.06 |
1.5622 times |
Fri 28 February 2025 |
96.37 (-4.18%) |
98.38 |
95.06 - 101.43 |
2.3654 times |
Fri 31 January 2025 |
100.57 (4.51%) |
96.62 |
94.84 - 101.89 |
0.4601 times |
Tue 31 December 2024 |
96.23 (-7.79%) |
104.40 |
95.23 - 104.40 |
2.0666 times |

DMA SMA EMA moving averages of Jpmorgan Betabuilders BBMC
DMA (daily moving average) of Jpmorgan Betabuilders BBMC
| DMA period | DMA value | | 5 day DMA | 104.93 | | 12 day DMA | 104.24 | | 20 day DMA | 104.43 | | 35 day DMA | 104.63 | | 50 day DMA | 104.08 | | 100 day DMA | 101.16 | | 150 day DMA | 97.15 | | 200 day DMA | 97.13 | EMA (exponential moving average) of Jpmorgan Betabuilders BBMC
| EMA period | EMA current | EMA prev | EMA prev2 | | 5 day EMA | 104.88 | 104.66 | 104.33 | | 12 day EMA | 104.58 | 104.45 | 104.29 | | 20 day EMA | 104.47 | 104.38 | 104.28 | | 35 day EMA | 104.14 | 104.07 | 104 | | 50 day EMA | 103.91 | 103.85 | 103.79 |
SMA (simple moving average) of Jpmorgan Betabuilders BBMC
| SMA period | SMA current | SMA prev | SMA prev2 | | 5 day SMA | 104.93 | 104.59 | 104.22 | | 12 day SMA | 104.24 | 104.26 | 104.18 | | 20 day SMA | 104.43 | 104.37 | 104.25 | | 35 day SMA | 104.63 | 104.61 | 104.58 | | 50 day SMA | 104.08 | 103.99 | 103.91 | | 100 day SMA | 101.16 | 101.04 | 100.92 | | 150 day SMA | 97.15 | 97.05 | 96.96 | | 200 day SMA | 97.13 | 97.09 | 97.05 |
|
|
