JpmorganBetabuilders BBJP full analysis,charts,indicators,moving averages,SMA,DMA,EMA,ADX,MACD,RSIJpmorgan Betabuilders BBJP WideScreen charts, DMA,SMA,EMA technical analysis, forecast prediction, by indicators ADX,MACD,RSI,CCI AMEX stock exchange
Daily price and charts and targets JpmorganBetabuilders Strong Daily Stock price targets for JpmorganBetabuilders BBJP are 68.05 and 68.41 | Daily Target 1 | 67.77 | | Daily Target 2 | 67.96 | | Daily Target 3 | 68.126666666667 | | Daily Target 4 | 68.32 | | Daily Target 5 | 68.49 |
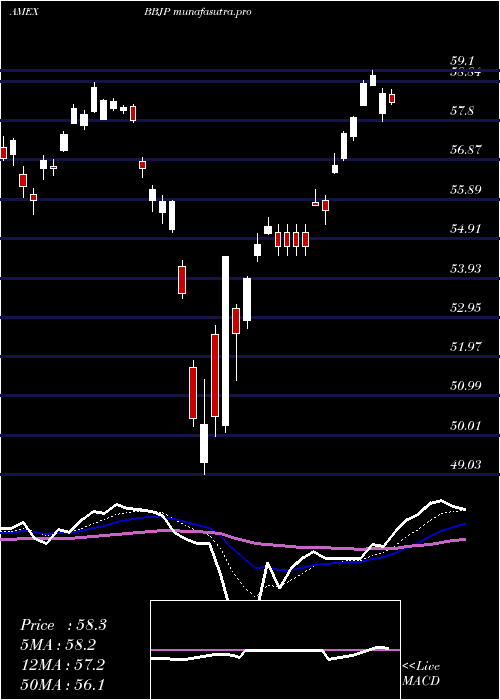
Daily price and volume Jpmorgan Betabuilders
| Date |
Closing |
Open |
Range |
Volume |
Fri 24 October 2025 |
68.16 (0.34%) |
68.01 |
67.93 - 68.29 |
0.6027 times |
Thu 23 October 2025 |
67.93 (0.01%) |
67.69 |
67.69 - 68.03 |
0.4469 times |
Wed 22 October 2025 |
67.92 (-0.32%) |
68.00 |
67.62 - 68.17 |
1.1047 times |
Tue 21 October 2025 |
68.14 (-1.19%) |
68.26 |
68.07 - 68.39 |
0.8096 times |
Mon 20 October 2025 |
68.96 (1.89%) |
68.33 |
68.33 - 69.16 |
0.471 times |
Fri 17 October 2025 |
67.68 (0.52%) |
67.49 |
67.41 - 67.76 |
0.9712 times |
Thu 16 October 2025 |
67.33 (0.28%) |
67.46 |
67.08 - 67.62 |
1.3933 times |
Wed 15 October 2025 |
67.14 (1.56%) |
67.09 |
66.80 - 67.32 |
1.142 times |
Tue 14 October 2025 |
66.11 (0.92%) |
65.48 |
65.39 - 66.44 |
0.8208 times |
Mon 13 October 2025 |
65.51 (1.14%) |
65.25 |
65.07 - 65.64 |
2.2378 times |
Fri 10 October 2025 |
64.77 (-3.82%) |
65.97 |
64.62 - 66.10 |
3.5311 times |
Weekly price and charts JpmorganBetabuilders Strong weekly Stock price targets for JpmorganBetabuilders BBJP are 67.12 and 68.66 | Weekly Target 1 | 66.77 | | Weekly Target 2 | 67.47 | | Weekly Target 3 | 68.313333333333 | | Weekly Target 4 | 69.01 | | Weekly Target 5 | 69.85 |
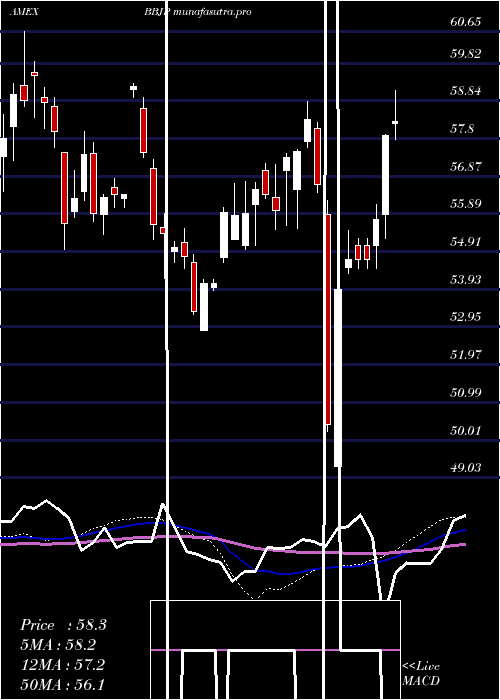
Weekly price and volumes for Jpmorgan Betabuilders
| Date |
Closing |
Open |
Range |
Volume |
Fri 24 October 2025 |
68.16 (0.71%) |
68.33 |
67.62 - 69.16 |
0.6685 times |
Fri 17 October 2025 |
67.68 (4.49%) |
65.25 |
65.07 - 67.76 |
1.2777 times |
Fri 10 October 2025 |
64.77 (-4.13%) |
68.43 |
64.62 - 69.03 |
1.5721 times |
Fri 03 October 2025 |
67.56 (1.61%) |
66.47 |
65.89 - 67.75 |
1.8935 times |
Fri 26 September 2025 |
66.49 (-0.4%) |
66.82 |
66.22 - 67.33 |
0.9726 times |
Fri 19 September 2025 |
66.76 (0.01%) |
66.89 |
66.60 - 67.66 |
1.1425 times |
Fri 12 September 2025 |
66.75 (1.99%) |
66.61 |
65.88 - 67.31 |
0.98 times |
Fri 05 September 2025 |
65.45 (1.17%) |
64.10 |
63.99 - 66.04 |
0.6015 times |
Fri 29 August 2025 |
64.69 (0%) |
64.78 |
64.55 - 64.84 |
0.1408 times |
Fri 29 August 2025 |
64.69 (-2.13%) |
65.62 |
64.49 - 65.74 |
0.751 times |
Fri 22 August 2025 |
66.10 (-0.12%) |
66.22 |
64.98 - 66.41 |
1.0042 times |
Monthly price and charts JpmorganBetabuilders Strong monthly Stock price targets for JpmorganBetabuilders BBJP are 66.39 and 70.93 | Monthly Target 1 | 62.77 | | Monthly Target 2 | 65.47 | | Monthly Target 3 | 67.313333333333 | | Monthly Target 4 | 70.01 | | Monthly Target 5 | 71.85 |
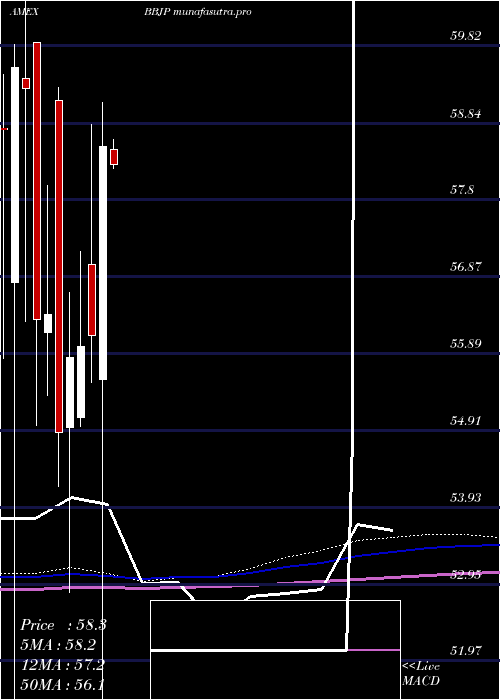
Monthly price and volumes Jpmorgan Betabuilders
| Date |
Closing |
Open |
Range |
Volume |
Fri 24 October 2025 |
68.16 (2.77%) |
66.50 |
64.62 - 69.16 |
0.9417 times |
Tue 30 September 2025 |
66.32 (2.52%) |
64.10 |
63.99 - 67.66 |
0.9643 times |
Fri 29 August 2025 |
64.69 (6.42%) |
61.20 |
60.62 - 66.41 |
0.7104 times |
Thu 31 July 2025 |
60.79 (-1.6%) |
61.56 |
58.83 - 63.50 |
1.5195 times |
Mon 30 June 2025 |
61.78 (1.76%) |
60.95 |
58.63 - 62.22 |
0.9384 times |
Fri 30 May 2025 |
60.71 (3.72%) |
58.50 |
58.25 - 61.37 |
0.6642 times |
Wed 30 April 2025 |
58.53 (4.28%) |
55.57 |
49.03 - 59.10 |
1.0748 times |
Mon 31 March 2025 |
56.13 (0.27%) |
57.03 |
55.52 - 58.81 |
0.9572 times |
Fri 28 February 2025 |
55.98 (0.25%) |
55.08 |
54.96 - 57.20 |
0.8734 times |
Fri 31 January 2025 |
55.84 (1.73%) |
54.95 |
52.85 - 56.68 |
1.3561 times |
Tue 31 December 2024 |
54.89 (-2.66%) |
59.12 |
54.20 - 59.29 |
0.8769 times |
DMA SMA EMA moving averages of Jpmorgan Betabuilders BBJP
DMA (daily moving average) of Jpmorgan Betabuilders BBJP
| DMA period | DMA value | | 5 day DMA | 68.22 | | 12 day DMA | 67.25 | | 20 day DMA | 67.19 | | 35 day DMA | 67.06 | | 50 day DMA | 66.53 | | 100 day DMA | 63.89 | | 150 day DMA | 61.68 | | 200 day DMA | 60.27 | EMA (exponential moving average) of Jpmorgan Betabuilders BBJP
| EMA period | EMA current | EMA prev | EMA prev2 | | 5 day EMA | 67.98 | 67.89 | 67.87 | | 12 day EMA | 67.62 | 67.52 | 67.44 | | 20 day EMA | 67.35 | 67.26 | 67.19 | | 35 day EMA | 66.91 | 66.84 | 66.78 | | 50 day EMA | 66.59 | 66.53 | 66.47 |
SMA (simple moving average) of Jpmorgan Betabuilders BBJP
| SMA period | SMA current | SMA prev | SMA prev2 | | 5 day SMA | 68.22 | 68.13 | 68.01 | | 12 day SMA | 67.25 | 67.2 | 67.18 | | 20 day SMA | 67.19 | 67.11 | 67.04 | | 35 day SMA | 67.06 | 66.98 | 66.9 | | 50 day SMA | 66.53 | 66.49 | 66.43 | | 100 day SMA | 63.89 | 63.82 | 63.75 | | 150 day SMA | 61.68 | 61.62 | 61.55 | | 200 day SMA | 60.27 | 60.2 | 60.14 |
|
|
