BiosharesBiotech BBC full analysis,charts,indicators,moving averages,SMA,DMA,EMA,ADX,MACD,RSIBioshares Biotech BBC WideScreen charts, DMA,SMA,EMA technical analysis, forecast prediction, by indicators ADX,MACD,RSI,CCI AMEX stock exchange
Daily price and charts and targets BiosharesBiotech Strong Daily Stock price targets for BiosharesBiotech BBC are 30.33 and 30.77 | Daily Target 1 | 30.21 | | Daily Target 2 | 30.44 | | Daily Target 3 | 30.65 | | Daily Target 4 | 30.88 | | Daily Target 5 | 31.09 |
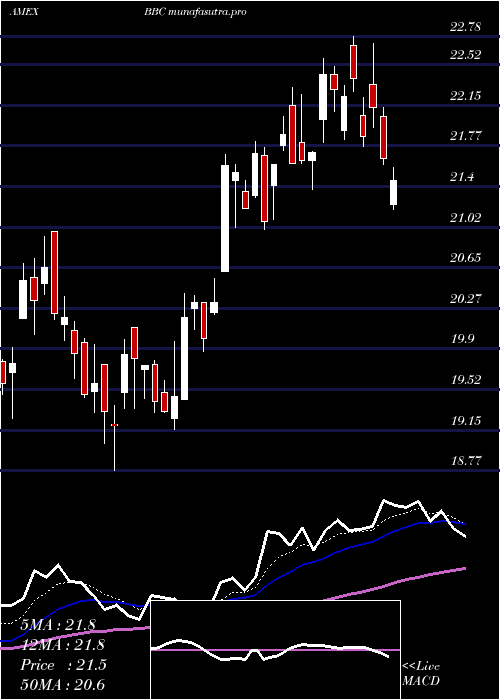
Daily price and volume Bioshares Biotech
| Date |
Closing |
Open |
Range |
Volume |
Fri 24 October 2025 |
30.67 (1.62%) |
30.72 |
30.42 - 30.86 |
0.3351 times |
Thu 23 October 2025 |
30.18 (-0.13%) |
30.27 |
30.08 - 30.52 |
0.9357 times |
Wed 22 October 2025 |
30.22 (-3.3%) |
30.91 |
29.80 - 31.02 |
1.8181 times |
Tue 21 October 2025 |
31.25 (-0.51%) |
31.30 |
31.21 - 31.61 |
0.4516 times |
Mon 20 October 2025 |
31.41 (4.32%) |
31.03 |
30.83 - 31.43 |
1.7558 times |
Fri 17 October 2025 |
30.11 (-1.25%) |
30.60 |
29.82 - 31.00 |
0.3401 times |
Thu 16 October 2025 |
30.49 (-0.52%) |
31.68 |
30.29 - 31.73 |
0.8817 times |
Wed 15 October 2025 |
30.65 (4.86%) |
29.70 |
29.70 - 30.66 |
1.1339 times |
Tue 14 October 2025 |
29.23 (0%) |
28.89 |
28.87 - 29.46 |
1.2643 times |
Mon 13 October 2025 |
29.23 (0.79%) |
29.07 |
28.84 - 29.31 |
1.0837 times |
Fri 10 October 2025 |
29.00 (-2.16%) |
29.68 |
28.35 - 29.68 |
1.8564 times |
Weekly price and charts BiosharesBiotech Strong weekly Stock price targets for BiosharesBiotech BBC are 29.33 and 31.14 | Weekly Target 1 | 28.88 | | Weekly Target 2 | 29.78 | | Weekly Target 3 | 30.693333333333 | | Weekly Target 4 | 31.59 | | Weekly Target 5 | 32.5 |
Weekly price and volumes for Bioshares Biotech
| Date |
Closing |
Open |
Range |
Volume |
Fri 24 October 2025 |
30.67 (1.86%) |
31.03 |
29.80 - 31.61 |
1.5956 times |
Fri 17 October 2025 |
30.11 (3.83%) |
29.07 |
28.84 - 31.73 |
1.4171 times |
Fri 10 October 2025 |
29.00 (3.02%) |
28.50 |
27.62 - 29.68 |
1.2879 times |
Fri 03 October 2025 |
28.15 (5%) |
27.00 |
26.57 - 28.29 |
0.808 times |
Fri 26 September 2025 |
26.81 (9.12%) |
24.58 |
24.58 - 26.81 |
0.8283 times |
Fri 19 September 2025 |
24.57 (1.87%) |
24.06 |
23.81 - 25.26 |
0.7951 times |
Fri 12 September 2025 |
24.12 (-1.07%) |
24.71 |
24.12 - 24.73 |
0.7769 times |
Fri 05 September 2025 |
24.38 (7.4%) |
22.86 |
22.83 - 24.53 |
1.108 times |
Fri 29 August 2025 |
22.70 (0%) |
22.97 |
22.43 - 23.00 |
0.2328 times |
Fri 29 August 2025 |
22.70 (-1.65%) |
23.12 |
22.43 - 23.51 |
1.1503 times |
Fri 22 August 2025 |
23.08 (0.57%) |
22.99 |
21.83 - 23.53 |
0.8419 times |
Monthly price and charts BiosharesBiotech Strong monthly Stock price targets for BiosharesBiotech BBC are 28.98 and 33.43 | Monthly Target 1 | 25.44 | | Monthly Target 2 | 28.06 | | Monthly Target 3 | 29.893333333333 | | Monthly Target 4 | 32.51 | | Monthly Target 5 | 34.34 |
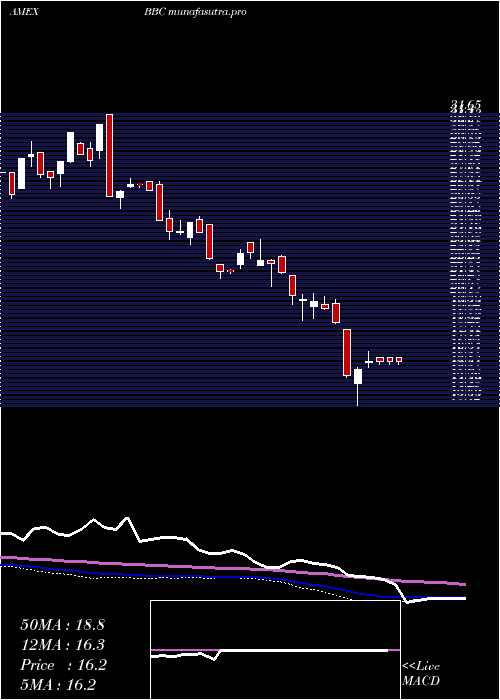
Monthly price and volumes Bioshares Biotech
| Date |
Closing |
Open |
Range |
Volume |
Fri 24 October 2025 |
30.67 (12.34%) |
27.28 |
27.28 - 31.73 |
0.4035 times |
Tue 30 September 2025 |
27.30 (20.26%) |
22.86 |
22.83 - 27.38 |
0.343 times |
Fri 29 August 2025 |
22.70 (4.8%) |
21.23 |
20.87 - 23.53 |
0.3722 times |
Thu 31 July 2025 |
21.66 (12.11%) |
19.25 |
19.15 - 22.78 |
1.3714 times |
Mon 30 June 2025 |
19.32 (6.21%) |
18.56 |
18.31 - 20.98 |
1.0625 times |
Fri 30 May 2025 |
18.19 (-4.71%) |
18.71 |
16.76 - 19.94 |
1.6637 times |
Wed 30 April 2025 |
19.09 (8.84%) |
17.49 |
13.42 - 19.24 |
2.9576 times |
Mon 31 March 2025 |
17.54 (-13.77%) |
20.02 |
17.29 - 20.45 |
1.6571 times |
Fri 28 February 2025 |
20.34 (-11.64%) |
22.22 |
19.78 - 23.86 |
0.0791 times |
Fri 31 January 2025 |
23.02 (-3.84%) |
24.13 |
21.41 - 25.28 |
0.0899 times |
Tue 31 December 2024 |
23.94 (-12.21%) |
27.50 |
23.51 - 27.50 |
0.0712 times |

DMA SMA EMA moving averages of Bioshares Biotech BBC
DMA (daily moving average) of Bioshares Biotech BBC
| DMA period | DMA value | | 5 day DMA | 30.75 | | 12 day DMA | 30.17 | | 20 day DMA | 29.24 | | 35 day DMA | 27.37 | | 50 day DMA | 26.04 | | 100 day DMA | 23.47 | | 150 day DMA | 21.48 | | 200 day DMA | 21.5 | EMA (exponential moving average) of Bioshares Biotech BBC
| EMA period | EMA current | EMA prev | EMA prev2 | | 5 day EMA | 30.51 | 30.43 | 30.55 | | 12 day EMA | 29.99 | 29.87 | 29.81 | | 20 day EMA | 29.16 | 29 | 28.88 | | 35 day EMA | 27.74 | 27.57 | 27.42 | | 50 day EMA | 26.18 | 26 | 25.83 |
SMA (simple moving average) of Bioshares Biotech BBC
| SMA period | SMA current | SMA prev | SMA prev2 | | 5 day SMA | 30.75 | 30.63 | 30.7 | | 12 day SMA | 30.17 | 30.03 | 29.85 | | 20 day SMA | 29.24 | 29.05 | 28.82 | | 35 day SMA | 27.37 | 27.19 | 27 | | 50 day SMA | 26.04 | 25.89 | 25.73 | | 100 day SMA | 23.47 | 23.36 | 23.24 | | 150 day SMA | 21.48 | 21.41 | 21.34 | | 200 day SMA | 21.5 | 21.46 | 21.44 |
|
|
