AdvBattery BATT full analysis,charts,indicators,moving averages,SMA,DMA,EMA,ADX,MACD,RSIAdv Battery BATT WideScreen charts, DMA,SMA,EMA technical analysis, forecast prediction, by indicators ADX,MACD,RSI,CCI AMEX stock exchange
Daily price and charts and targets AdvBattery Strong Daily Stock price targets for AdvBattery BATT are 13 and 13.29 | Daily Target 1 | 12.76 | | Daily Target 2 | 12.94 | | Daily Target 3 | 13.053333333333 | | Daily Target 4 | 13.23 | | Daily Target 5 | 13.34 |
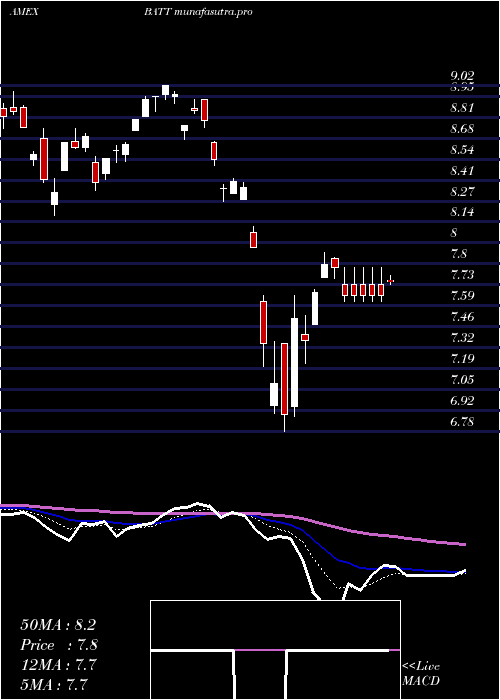
Daily price and volume Adv Battery
| Date |
Closing |
Open |
Range |
Volume |
Thu 23 October 2025 |
13.11 (2.18%) |
12.93 |
12.88 - 13.17 |
0.3417 times |
Wed 22 October 2025 |
12.83 (-1.91%) |
13.01 |
12.70 - 13.08 |
0.7538 times |
Tue 21 October 2025 |
13.08 (-1.88%) |
13.22 |
13.02 - 13.26 |
0.8523 times |
Mon 20 October 2025 |
13.33 (1.76%) |
13.30 |
13.19 - 13.38 |
0.9709 times |
Fri 17 October 2025 |
13.10 (-1.21%) |
13.29 |
13.00 - 13.29 |
0.6797 times |
Thu 16 October 2025 |
13.26 (-0.53%) |
13.33 |
13.16 - 13.57 |
1.2329 times |
Wed 15 October 2025 |
13.33 (0.83%) |
13.39 |
13.23 - 13.49 |
0.9031 times |
Tue 14 October 2025 |
13.22 (-1.71%) |
13.17 |
12.85 - 13.31 |
0.8652 times |
Mon 13 October 2025 |
13.45 (6.58%) |
13.23 |
13.11 - 13.50 |
1.3498 times |
Fri 10 October 2025 |
12.62 (-5.61%) |
13.21 |
12.60 - 13.24 |
2.0506 times |
Thu 09 October 2025 |
13.37 (-0.37%) |
13.56 |
13.33 - 13.60 |
0.9615 times |
Weekly price and charts AdvBattery Strong weekly Stock price targets for AdvBattery BATT are 12.57 and 13.25 | Weekly Target 1 | 12.38 | | Weekly Target 2 | 12.75 | | Weekly Target 3 | 13.063333333333 | | Weekly Target 4 | 13.43 | | Weekly Target 5 | 13.74 |
Weekly price and volumes for Adv Battery
| Date |
Closing |
Open |
Range |
Volume |
Thu 23 October 2025 |
13.11 (0.08%) |
13.30 |
12.70 - 13.38 |
0.7823 times |
Fri 17 October 2025 |
13.10 (3.8%) |
13.23 |
12.85 - 13.57 |
1.3484 times |
Fri 10 October 2025 |
12.62 (-5.47%) |
13.84 |
12.60 - 13.84 |
2.3649 times |
Fri 03 October 2025 |
13.35 (7.23%) |
12.64 |
12.62 - 13.98 |
2.552 times |
Fri 26 September 2025 |
12.45 (1.88%) |
12.03 |
12.03 - 12.48 |
0.7697 times |
Fri 19 September 2025 |
12.22 (5.07%) |
11.76 |
11.76 - 12.22 |
0.8053 times |
Fri 12 September 2025 |
11.63 (3.65%) |
11.43 |
11.15 - 11.65 |
0.347 times |
Fri 05 September 2025 |
11.22 (1.08%) |
10.94 |
10.81 - 11.24 |
0.5505 times |
Fri 29 August 2025 |
11.10 (0%) |
11.15 |
10.86 - 11.15 |
0.0948 times |
Fri 29 August 2025 |
11.10 (1.37%) |
10.98 |
10.86 - 11.15 |
0.385 times |
Fri 22 August 2025 |
10.95 (2.05%) |
10.80 |
10.48 - 10.97 |
0.3572 times |

Monthly price and charts AdvBattery Strong monthly Stock price targets for AdvBattery BATT are 12.86 and 14.24 | Monthly Target 1 | 11.85 | | Monthly Target 2 | 12.48 | | Monthly Target 3 | 13.23 | | Monthly Target 4 | 13.86 | | Monthly Target 5 | 14.61 |
Monthly price and volumes Adv Battery
| Date |
Closing |
Open |
Range |
Volume |
Thu 23 October 2025 |
13.11 (0.92%) |
12.86 |
12.60 - 13.98 |
2.7507 times |
Tue 30 September 2025 |
12.99 (17.03%) |
10.94 |
10.81 - 13.00 |
1.2875 times |
Fri 29 August 2025 |
11.10 (13.15%) |
9.71 |
9.67 - 11.15 |
0.7535 times |
Thu 31 July 2025 |
9.81 (5.03%) |
9.34 |
9.27 - 10.60 |
1.1511 times |
Mon 30 June 2025 |
9.34 (8.48%) |
8.60 |
8.56 - 9.48 |
0.7458 times |
Fri 30 May 2025 |
8.61 (5.51%) |
8.20 |
8.18 - 8.94 |
0.5202 times |
Wed 30 April 2025 |
8.16 (-2.28%) |
8.32 |
6.78 - 8.42 |
0.4896 times |
Mon 31 March 2025 |
8.35 (-2.57%) |
8.68 |
8.18 - 9.02 |
0.5016 times |
Fri 28 February 2025 |
8.57 (-2.72%) |
8.53 |
8.50 - 9.17 |
0.598 times |
Fri 31 January 2025 |
8.81 (0.11%) |
8.74 |
8.60 - 9.33 |
1.2019 times |
Tue 31 December 2024 |
8.80 (-4.97%) |
9.36 |
8.74 - 9.85 |
1.0913 times |

DMA SMA EMA moving averages of Adv Battery BATT
DMA (daily moving average) of Adv Battery BATT
| DMA period | DMA value | | 5 day DMA | 13.09 | | 12 day DMA | 13.18 | | 20 day DMA | 13.12 | | 35 day DMA | 12.58 | | 50 day DMA | 12.07 | | 100 day DMA | 10.87 | | 150 day DMA | 9.99 | | 200 day DMA | 9.71 | EMA (exponential moving average) of Adv Battery BATT
| EMA period | EMA current | EMA prev | EMA prev2 | | 5 day EMA | 13.08 | 13.07 | 13.19 | | 12 day EMA | 13.08 | 13.08 | 13.13 | | 20 day EMA | 12.96 | 12.94 | 12.95 | | 35 day EMA | 12.54 | 12.51 | 12.49 | | 50 day EMA | 12.05 | 12.01 | 11.98 |
SMA (simple moving average) of Adv Battery BATT
| SMA period | SMA current | SMA prev | SMA prev2 | | 5 day SMA | 13.09 | 13.12 | 13.22 | | 12 day SMA | 13.18 | 13.17 | 13.21 | | 20 day SMA | 13.12 | 13.09 | 13.06 | | 35 day SMA | 12.58 | 12.51 | 12.46 | | 50 day SMA | 12.07 | 12.02 | 11.98 | | 100 day SMA | 10.87 | 10.82 | 10.78 | | 150 day SMA | 9.99 | 9.96 | 9.94 | | 200 day SMA | 9.71 | 9.68 | 9.67 |
|
|
