AvalonHoldings AWX full analysis,charts,indicators,moving averages,SMA,DMA,EMA,ADX,MACD,RSIAvalon Holdings AWX WideScreen charts, DMA,SMA,EMA technical analysis, forecast prediction, by indicators ADX,MACD,RSI,CCI AMEX stock exchange
Daily price and charts and targets AvalonHoldings Strong Daily Stock price targets for AvalonHoldings AWX are 2.45 and 2.98 | Daily Target 1 | 2.34 | | Daily Target 2 | 2.56 | | Daily Target 3 | 2.8733333333333 | | Daily Target 4 | 3.09 | | Daily Target 5 | 3.4 |
Daily price and volume Avalon Holdings
| Date |
Closing |
Open |
Range |
Volume |
Fri 24 October 2025 |
2.77 (3.36%) |
3.10 |
2.66 - 3.19 |
0.2245 times |
Thu 23 October 2025 |
2.68 (0.37%) |
2.62 |
2.56 - 2.74 |
0.0107 times |
Wed 22 October 2025 |
2.67 (2.69%) |
2.60 |
2.60 - 2.79 |
0.0361 times |
Tue 21 October 2025 |
2.60 (-2.99%) |
2.65 |
2.60 - 2.76 |
0.041 times |
Mon 20 October 2025 |
2.68 (-4.29%) |
3.00 |
2.65 - 3.00 |
0.0464 times |
Fri 17 October 2025 |
2.80 (1.45%) |
2.60 |
2.60 - 2.86 |
0.0681 times |
Thu 16 October 2025 |
2.76 (-14.55%) |
3.10 |
2.60 - 3.10 |
0.1501 times |
Wed 15 October 2025 |
3.23 (-36.04%) |
3.50 |
3.00 - 3.50 |
0.7871 times |
Tue 14 October 2025 |
5.05 (83.64%) |
2.78 |
2.70 - 5.43 |
8.6183 times |
Mon 13 October 2025 |
2.75 (4.56%) |
2.60 |
2.57 - 2.75 |
0.0178 times |
Fri 10 October 2025 |
2.63 (0%) |
2.63 |
2.57 - 2.66 |
0.0042 times |
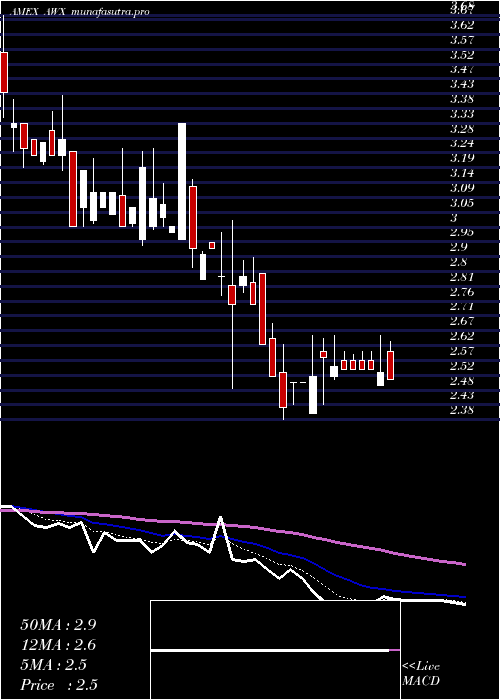
Weekly price and charts AvalonHoldings Strong weekly Stock price targets for AvalonHoldings AWX are 2.35 and 2.98 | Weekly Target 1 | 2.21 | | Weekly Target 2 | 2.49 | | Weekly Target 3 | 2.84 | | Weekly Target 4 | 3.12 | | Weekly Target 5 | 3.47 |
Weekly price and volumes for Avalon Holdings
| Date |
Closing |
Open |
Range |
Volume |
Fri 24 October 2025 |
2.77 (-1.07%) |
3.00 |
2.56 - 3.19 |
0.3561 times |
Fri 17 October 2025 |
2.80 (6.46%) |
2.60 |
2.57 - 5.43 |
9.5728 times |
Fri 10 October 2025 |
2.63 (0%) |
2.53 |
2.53 - 2.66 |
0.01 times |
Fri 03 October 2025 |
2.63 (0.77%) |
2.54 |
2.50 - 2.63 |
0.0173 times |
Fri 26 September 2025 |
2.61 (0%) |
2.65 |
2.54 - 2.65 |
0.0076 times |
Fri 19 September 2025 |
2.61 (6.97%) |
2.47 |
2.46 - 2.61 |
0.0106 times |
Fri 12 September 2025 |
2.44 (-0.81%) |
2.49 |
2.40 - 2.49 |
0.0061 times |
Fri 05 September 2025 |
2.46 (-2.77%) |
2.50 |
2.44 - 2.50 |
0.0072 times |
Fri 29 August 2025 |
2.53 (0%) |
2.51 |
2.51 - 2.53 |
0.0004 times |
Fri 29 August 2025 |
2.53 (2.85%) |
2.50 |
2.46 - 2.60 |
0.0117 times |
Fri 22 August 2025 |
2.46 (-1.6%) |
2.46 |
2.42 - 2.49 |
0.0044 times |

Monthly price and charts AvalonHoldings Strong monthly Stock price targets for AvalonHoldings AWX are 2.64 and 5.57 | Monthly Target 1 | 0.64 | | Monthly Target 2 | 1.7 | | Monthly Target 3 | 3.5666666666667 | | Monthly Target 4 | 4.63 | | Monthly Target 5 | 6.5 |
Monthly price and volumes Avalon Holdings
| Date |
Closing |
Open |
Range |
Volume |
Fri 24 October 2025 |
2.77 (6.13%) |
2.55 |
2.50 - 5.43 |
9.041 times |
Tue 30 September 2025 |
2.61 (3.16%) |
2.50 |
2.40 - 2.65 |
0.037 times |
Fri 29 August 2025 |
2.53 (-2.32%) |
2.57 |
2.42 - 2.65 |
0.0402 times |
Thu 31 July 2025 |
2.59 (4.02%) |
2.47 |
2.41 - 2.70 |
0.0488 times |
Mon 30 June 2025 |
2.49 (1.63%) |
2.45 |
2.10 - 2.59 |
0.2236 times |
Fri 30 May 2025 |
2.45 (-10.58%) |
2.85 |
2.30 - 2.87 |
0.108 times |
Wed 30 April 2025 |
2.74 (-3.52%) |
2.81 |
2.38 - 3.02 |
0.1204 times |
Mon 31 March 2025 |
2.84 (-13.15%) |
3.31 |
2.78 - 3.42 |
0.1055 times |
Fri 28 February 2025 |
3.27 (-9.42%) |
3.63 |
3.17 - 3.72 |
0.1294 times |
Fri 31 January 2025 |
3.61 (-6.72%) |
3.99 |
3.14 - 3.99 |
0.1461 times |
Tue 31 December 2024 |
3.87 (18.35%) |
3.19 |
3.14 - 3.99 |
0.112 times |

DMA SMA EMA moving averages of Avalon Holdings AWX
DMA (daily moving average) of Avalon Holdings AWX
| DMA period | DMA value | | 5 day DMA | 2.68 | | 12 day DMA | 2.94 | | 20 day DMA | 2.8 | | 35 day DMA | 2.68 | | 50 day DMA | 2.62 | | 100 day DMA | 2.56 | | 150 day DMA | 2.58 | | 200 day DMA | 2.79 | EMA (exponential moving average) of Avalon Holdings AWX
| EMA period | EMA current | EMA prev | EMA prev2 | | 5 day EMA | 2.75 | 2.74 | 2.77 | | 12 day EMA | 2.81 | 2.82 | 2.84 | | 20 day EMA | 2.79 | 2.79 | 2.8 | | 35 day EMA | 2.72 | 2.72 | 2.72 | | 50 day EMA | 2.62 | 2.61 | 2.61 |
SMA (simple moving average) of Avalon Holdings AWX
| SMA period | SMA current | SMA prev | SMA prev2 | | 5 day SMA | 2.68 | 2.69 | 2.7 | | 12 day SMA | 2.94 | 2.92 | 2.91 | | 20 day SMA | 2.8 | 2.79 | 2.79 | | 35 day SMA | 2.68 | 2.67 | 2.66 | | 50 day SMA | 2.62 | 2.62 | 2.62 | | 100 day SMA | 2.56 | 2.56 | 2.56 | | 150 day SMA | 2.58 | 2.58 | 2.58 | | 200 day SMA | 2.79 | 2.79 | 2.8 |
|
|
