AvantisU AVUS full analysis,charts,indicators,moving averages,SMA,DMA,EMA,ADX,MACD,RSIAvantis U AVUS WideScreen charts, DMA,SMA,EMA technical analysis, forecast prediction, by indicators ADX,MACD,RSI,CCI AMEX stock exchange
Daily price and charts and targets AvantisU Strong Daily Stock price targets for AvantisU AVUS are 110 and 110.41 | Daily Target 1 | 109.7 | | Daily Target 2 | 109.89 | | Daily Target 3 | 110.11333333333 | | Daily Target 4 | 110.3 | | Daily Target 5 | 110.52 |
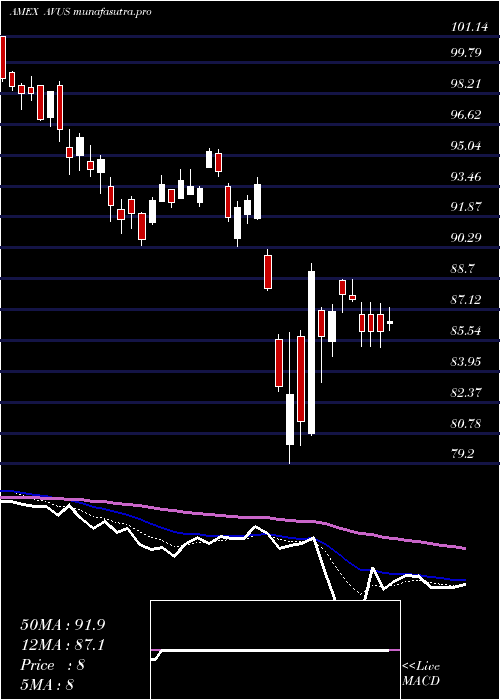
Daily price and volume Avantis U
| Date |
Closing |
Open |
Range |
Volume |
Fri 24 October 2025 |
110.07 (0.82%) |
109.93 |
109.93 - 110.34 |
1.0283 times |
Thu 23 October 2025 |
109.17 (0.68%) |
108.67 |
108.60 - 109.36 |
1.4885 times |
Wed 22 October 2025 |
108.43 (-0.69%) |
109.18 |
107.75 - 109.21 |
1.1572 times |
Tue 21 October 2025 |
109.18 (0.17%) |
109.00 |
108.83 - 109.45 |
0.8071 times |
Mon 20 October 2025 |
109.00 (1.09%) |
108.44 |
108.44 - 109.16 |
0.9788 times |
Fri 17 October 2025 |
107.82 (0.48%) |
107.13 |
106.94 - 107.99 |
0.9569 times |
Thu 16 October 2025 |
107.31 (-0.97%) |
108.59 |
106.84 - 108.67 |
1.1761 times |
Wed 15 October 2025 |
108.36 (0.42%) |
108.91 |
107.48 - 109.20 |
0.8864 times |
Tue 14 October 2025 |
107.91 (0.25%) |
106.52 |
106.30 - 108.50 |
0.7235 times |
Mon 13 October 2025 |
107.64 (1.59%) |
107.21 |
107.07 - 107.82 |
0.7972 times |
Fri 10 October 2025 |
105.96 (-2.78%) |
109.07 |
105.91 - 109.38 |
1.2761 times |
Weekly price and charts AvantisU Strong weekly Stock price targets for AvantisU AVUS are 108.91 and 111.5 | Weekly Target 1 | 106.8 | | Weekly Target 2 | 108.43 | | Weekly Target 3 | 109.38666666667 | | Weekly Target 4 | 111.02 | | Weekly Target 5 | 111.98 |
Weekly price and volumes for Avantis U
| Date |
Closing |
Open |
Range |
Volume |
Fri 24 October 2025 |
110.07 (2.09%) |
108.44 |
107.75 - 110.34 |
1.1473 times |
Fri 17 October 2025 |
107.82 (1.76%) |
107.21 |
106.30 - 109.20 |
0.9541 times |
Fri 10 October 2025 |
105.96 (-2.98%) |
109.20 |
105.91 - 109.68 |
0.9999 times |
Fri 03 October 2025 |
109.21 (0.76%) |
108.76 |
107.91 - 109.75 |
0.9923 times |
Fri 26 September 2025 |
108.39 (-0.38%) |
108.62 |
107.15 - 109.30 |
1.2706 times |
Fri 19 September 2025 |
108.80 (1.11%) |
108.04 |
107.14 - 109.08 |
1.3647 times |
Fri 12 September 2025 |
107.61 (1.04%) |
106.77 |
106.31 - 108.05 |
1.1961 times |
Fri 05 September 2025 |
106.50 (0.35%) |
104.78 |
104.56 - 107.34 |
0.9336 times |
Fri 29 August 2025 |
106.13 (0%) |
106.49 |
105.83 - 106.52 |
0.1847 times |
Fri 29 August 2025 |
106.13 (0.11%) |
105.87 |
105.47 - 106.72 |
0.9567 times |
Fri 22 August 2025 |
106.01 (0.93%) |
104.86 |
103.64 - 106.21 |
0.951 times |

Monthly price and charts AvantisU Strong monthly Stock price targets for AvantisU AVUS are 107.99 and 112.42 | Monthly Target 1 | 104.34 | | Monthly Target 2 | 107.21 | | Monthly Target 3 | 108.77333333333 | | Monthly Target 4 | 111.64 | | Monthly Target 5 | 113.2 |
Monthly price and volumes Avantis U
| Date |
Closing |
Open |
Range |
Volume |
Fri 24 October 2025 |
110.07 (1.26%) |
108.23 |
105.91 - 110.34 |
0.515 times |
Tue 30 September 2025 |
108.70 (2.42%) |
104.78 |
104.56 - 109.30 |
0.7528 times |
Fri 29 August 2025 |
106.13 (2.94%) |
101.96 |
100.82 - 106.72 |
0.7788 times |
Thu 31 July 2025 |
103.10 (2.26%) |
100.63 |
100.60 - 104.41 |
0.8208 times |
Mon 30 June 2025 |
100.82 (4.69%) |
96.13 |
95.54 - 100.98 |
0.6864 times |
Fri 30 May 2025 |
96.30 (6.26%) |
91.43 |
91.12 - 97.74 |
0.9281 times |
Wed 30 April 2025 |
90.63 (-1.89%) |
92.00 |
79.20 - 93.89 |
2.0629 times |
Mon 31 March 2025 |
92.38 (-6.02%) |
98.62 |
90.34 - 98.83 |
1.3192 times |
Fri 28 February 2025 |
98.30 (-1.99%) |
98.58 |
96.51 - 101.68 |
0.7881 times |
Fri 31 January 2025 |
100.30 (3.48%) |
97.41 |
95.58 - 101.57 |
1.348 times |
Tue 31 December 2024 |
96.93 (-4.54%) |
101.80 |
95.94 - 102.03 |
0.7106 times |

DMA SMA EMA moving averages of Avantis U AVUS
DMA (daily moving average) of Avantis U AVUS
| DMA period | DMA value | | 5 day DMA | 109.17 | | 12 day DMA | 108.32 | | 20 day DMA | 108.6 | | 35 day DMA | 108.32 | | 50 day DMA | 107.54 | | 100 day DMA | 104.45 | | 150 day DMA | 100.17 | | 200 day DMA | 99.64 | EMA (exponential moving average) of Avantis U AVUS
| EMA period | EMA current | EMA prev | EMA prev2 | | 5 day EMA | 109.17 | 108.72 | 108.5 | | 12 day EMA | 108.73 | 108.49 | 108.37 | | 20 day EMA | 108.52 | 108.36 | 108.27 | | 35 day EMA | 107.96 | 107.84 | 107.76 | | 50 day EMA | 107.49 | 107.38 | 107.31 |
SMA (simple moving average) of Avantis U AVUS
| SMA period | SMA current | SMA prev | SMA prev2 | | 5 day SMA | 109.17 | 108.72 | 108.35 | | 12 day SMA | 108.32 | 108.27 | 108.25 | | 20 day SMA | 108.6 | 108.52 | 108.44 | | 35 day SMA | 108.32 | 108.22 | 108.16 | | 50 day SMA | 107.54 | 107.44 | 107.36 | | 100 day SMA | 104.45 | 104.32 | 104.19 | | 150 day SMA | 100.17 | 100.06 | 99.95 | | 200 day SMA | 99.64 | 99.58 | 99.53 |
|
|
