ArkIndustrial ARKQ full analysis,charts,indicators,moving averages,SMA,DMA,EMA,ADX,MACD,RSIArk Industrial ARKQ WideScreen charts, DMA,SMA,EMA technical analysis, forecast prediction, by indicators ADX,MACD,RSI,CCI AMEX stock exchange
Daily price and charts and targets ArkIndustrial Strong Daily Stock price targets for ArkIndustrial ARKQ are 115.99 and 119.77 | Daily Target 1 | 112.9 | | Daily Target 2 | 115.29 | | Daily Target 3 | 116.68333333333 | | Daily Target 4 | 119.07 | | Daily Target 5 | 120.46 |
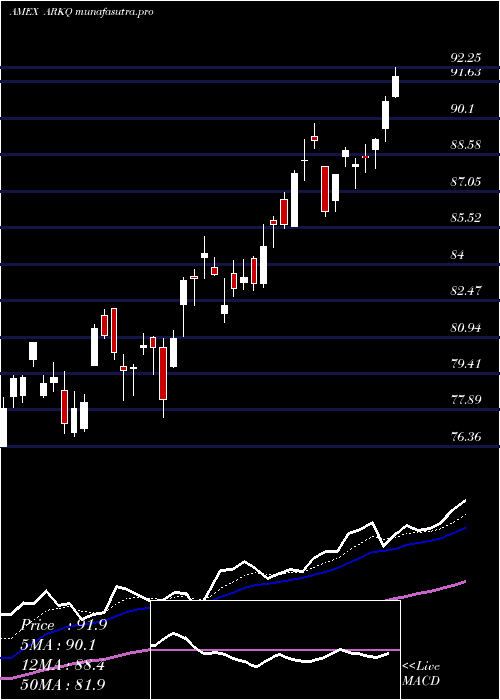
Daily price and volume Ark Industrial
| Date |
Closing |
Open |
Range |
Volume |
Thu 23 October 2025 |
117.67 (2.48%) |
115.06 |
114.30 - 118.08 |
0.5765 times |
Wed 22 October 2025 |
114.82 (-3.23%) |
117.69 |
112.55 - 118.20 |
1.0067 times |
Tue 21 October 2025 |
118.65 (-0.38%) |
119.01 |
117.42 - 119.71 |
0.5114 times |
Mon 20 October 2025 |
119.10 (2.46%) |
117.47 |
117.47 - 119.51 |
0.6423 times |
Fri 17 October 2025 |
116.24 (-1.61%) |
114.00 |
112.28 - 117.90 |
0.7462 times |
Thu 16 October 2025 |
118.14 (-2.3%) |
122.01 |
117.72 - 123.75 |
0.7189 times |
Wed 15 October 2025 |
120.92 (0.16%) |
123.31 |
118.79 - 124.18 |
1.5606 times |
Tue 14 October 2025 |
120.73 (0.48%) |
117.89 |
115.73 - 122.25 |
1.0355 times |
Mon 13 October 2025 |
120.15 (3.62%) |
119.43 |
118.27 - 120.82 |
1.1689 times |
Fri 10 October 2025 |
115.95 (-4.73%) |
121.81 |
115.78 - 123.23 |
2.0331 times |
Thu 09 October 2025 |
121.71 (-1.03%) |
122.82 |
120.44 - 123.77 |
0.9898 times |
Weekly price and charts ArkIndustrial Strong weekly Stock price targets for ArkIndustrial ARKQ are 115.11 and 122.27 | Weekly Target 1 | 109.48 | | Weekly Target 2 | 113.58 | | Weekly Target 3 | 116.64333333333 | | Weekly Target 4 | 120.74 | | Weekly Target 5 | 123.8 |
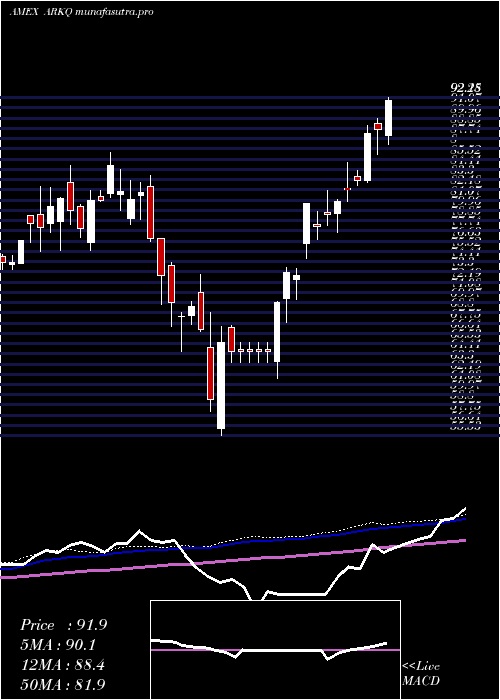
Weekly price and volumes for Ark Industrial
| Date |
Closing |
Open |
Range |
Volume |
Thu 23 October 2025 |
117.67 (1.23%) |
117.47 |
112.55 - 119.71 |
0.8348 times |
Fri 17 October 2025 |
116.24 (0.25%) |
119.43 |
112.28 - 124.18 |
1.5952 times |
Fri 10 October 2025 |
115.95 (-0.57%) |
118.50 |
115.78 - 124.23 |
2.4839 times |
Fri 03 October 2025 |
116.62 (6.69%) |
111.09 |
109.74 - 118.03 |
1.1013 times |
Fri 26 September 2025 |
109.31 (0.84%) |
108.63 |
105.62 - 112.11 |
1.2059 times |
Fri 19 September 2025 |
108.40 (7.59%) |
102.30 |
101.72 - 108.76 |
0.9192 times |
Fri 12 September 2025 |
100.75 (3.67%) |
97.63 |
96.06 - 100.93 |
0.6099 times |
Fri 05 September 2025 |
97.18 (-0.8%) |
95.64 |
94.90 - 98.08 |
0.4903 times |
Fri 29 August 2025 |
97.96 (0%) |
99.68 |
97.40 - 99.86 |
0.1006 times |
Fri 29 August 2025 |
97.96 (-0.59%) |
98.43 |
97.40 - 100.29 |
0.659 times |
Fri 22 August 2025 |
98.54 (-1.41%) |
99.85 |
92.56 - 100.49 |
1.0625 times |
Monthly price and charts ArkIndustrial Strong monthly Stock price targets for ArkIndustrial ARKQ are 114.34 and 127.57 | Monthly Target 1 | 104.4 | | Monthly Target 2 | 111.04 | | Monthly Target 3 | 117.63333333333 | | Monthly Target 4 | 124.27 | | Monthly Target 5 | 130.86 |
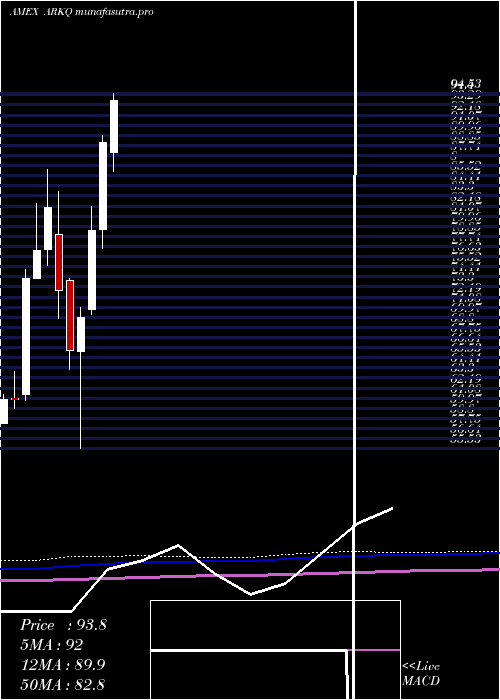
Monthly price and volumes Ark Industrial
| Date |
Closing |
Open |
Range |
Volume |
Thu 23 October 2025 |
117.67 (5.48%) |
111.10 |
111.00 - 124.23 |
1.6319 times |
Tue 30 September 2025 |
111.56 (13.88%) |
95.64 |
94.90 - 112.11 |
1.0092 times |
Fri 29 August 2025 |
97.96 (0.92%) |
94.78 |
92.56 - 103.13 |
1.1209 times |
Thu 31 July 2025 |
97.07 (8.86%) |
88.08 |
86.00 - 100.79 |
1.1898 times |
Mon 30 June 2025 |
89.17 (12.11%) |
79.62 |
77.57 - 89.90 |
0.764 times |
Fri 30 May 2025 |
79.54 (13.69%) |
70.78 |
70.25 - 82.15 |
1.2198 times |
Wed 30 April 2025 |
69.96 (5.58%) |
66.16 |
55.53 - 71.02 |
0.7409 times |
Mon 31 March 2025 |
66.26 (-9.06%) |
73.98 |
64.19 - 74.26 |
0.5518 times |
Fri 28 February 2025 |
72.86 (-11.15%) |
79.05 |
69.78 - 83.73 |
0.7273 times |
Fri 31 January 2025 |
82.00 (6.15%) |
77.41 |
75.62 - 86.25 |
1.0446 times |
Tue 31 December 2024 |
77.25 (4.03%) |
74.24 |
74.24 - 82.51 |
0.5664 times |
DMA SMA EMA moving averages of Ark Industrial ARKQ
DMA (daily moving average) of Ark Industrial ARKQ
| DMA period | DMA value | | 5 day DMA | 117.3 | | 12 day DMA | 118.92 | | 20 day DMA | 117.34 | | 35 day DMA | 111.43 | | 50 day DMA | 107.37 | | 100 day DMA | 99.23 | | 150 day DMA | 89.67 | | 200 day DMA | 86.47 | EMA (exponential moving average) of Ark Industrial ARKQ
| EMA period | EMA current | EMA prev | EMA prev2 | | 5 day EMA | 117.47 | 117.37 | 118.64 | | 12 day EMA | 117.55 | 117.53 | 118.02 | | 20 day EMA | 116.06 | 115.89 | 116 | | 35 day EMA | 112.36 | 112.05 | 111.89 | | 50 day EMA | 107.79 | 107.39 | 107.09 |
SMA (simple moving average) of Ark Industrial ARKQ
| SMA period | SMA current | SMA prev | SMA prev2 | | 5 day SMA | 117.3 | 117.39 | 118.61 | | 12 day SMA | 118.92 | 119.16 | 119.76 | | 20 day SMA | 117.34 | 116.88 | 116.61 | | 35 day SMA | 111.43 | 110.81 | 110.28 | | 50 day SMA | 107.37 | 107.03 | 106.78 | | 100 day SMA | 99.23 | 98.85 | 98.5 | | 150 day SMA | 89.67 | 89.35 | 89.05 | | 200 day SMA | 86.47 | 86.28 | 86.11 |
|
|
