AggregateBond AGG full analysis,charts,indicators,moving averages,SMA,DMA,EMA,ADX,MACD,RSIAggregate Bond AGG WideScreen charts, DMA,SMA,EMA technical analysis, forecast prediction, by indicators ADX,MACD,RSI,CCI AMEX stock exchange
Daily price and charts and targets AggregateBond Strong Daily Stock price targets for AggregateBond AGG are 100.95 and 101.11 | Daily Target 1 | 100.91 | | Daily Target 2 | 100.98 | | Daily Target 3 | 101.07333333333 | | Daily Target 4 | 101.14 | | Daily Target 5 | 101.23 |
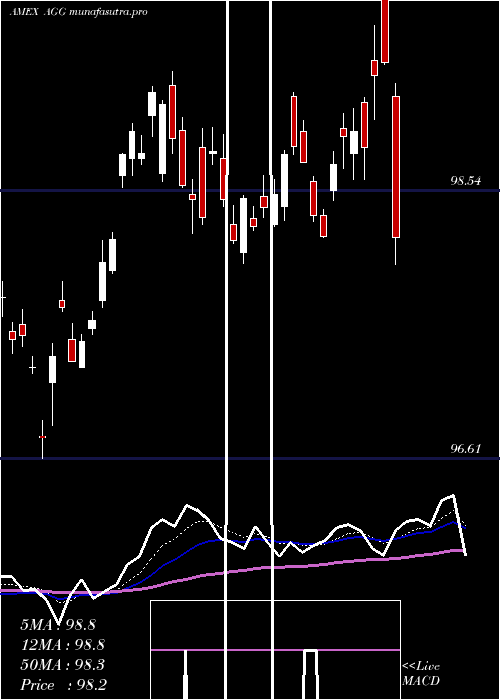
Daily price and volume Aggregate Bond
| Date |
Closing |
Open |
Range |
Volume |
Thu 23 October 2025 |
101.04 (-0.19%) |
101.11 |
101.01 - 101.17 |
0.9986 times |
Wed 22 October 2025 |
101.23 (0%) |
101.40 |
101.02 - 101.50 |
1.0656 times |
Tue 21 October 2025 |
101.23 (0.12%) |
101.27 |
101.20 - 101.35 |
1.4112 times |
Mon 20 October 2025 |
101.11 (0.15%) |
101.35 |
101.02 - 101.35 |
0.6237 times |
Fri 17 October 2025 |
100.96 (-0.14%) |
101.01 |
100.86 - 101.01 |
1.2304 times |
Thu 16 October 2025 |
101.10 (0.36%) |
100.40 |
100.38 - 101.38 |
1.0427 times |
Wed 15 October 2025 |
100.74 (-0.04%) |
100.82 |
100.65 - 100.93 |
0.6854 times |
Tue 14 October 2025 |
100.78 (0.16%) |
100.57 |
100.53 - 100.79 |
0.9261 times |
Mon 13 October 2025 |
100.62 (0.19%) |
100.46 |
100.36 - 100.63 |
0.9056 times |
Fri 10 October 2025 |
100.43 (0.41%) |
100.36 |
100.25 - 100.54 |
1.1106 times |
Thu 09 October 2025 |
100.02 (-0.12%) |
100.08 |
100.00 - 100.10 |
0.5659 times |
Weekly price and charts AggregateBond Strong weekly Stock price targets for AggregateBond AGG are 100.78 and 101.27 | Weekly Target 1 | 100.69 | | Weekly Target 2 | 100.87 | | Weekly Target 3 | 101.18333333333 | | Weekly Target 4 | 101.36 | | Weekly Target 5 | 101.67 |
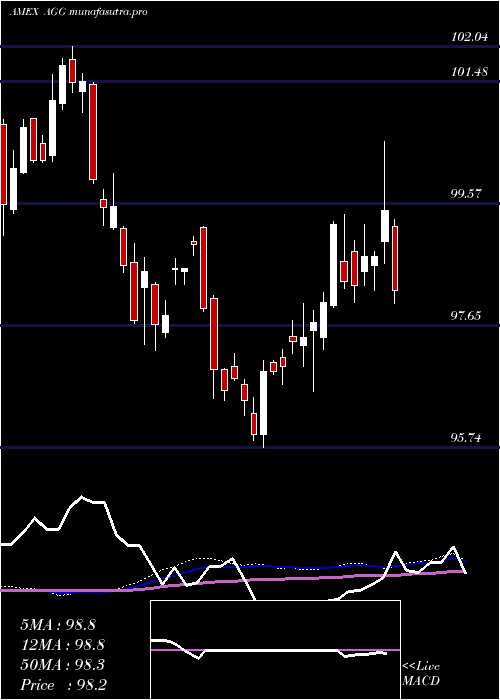
Weekly price and volumes for Aggregate Bond
| Date |
Closing |
Open |
Range |
Volume |
Thu 23 October 2025 |
101.04 (0.08%) |
101.35 |
101.01 - 101.50 |
1.1328 times |
Fri 17 October 2025 |
100.96 (0.53%) |
100.46 |
100.36 - 101.38 |
1.3237 times |
Fri 10 October 2025 |
100.43 (0.25%) |
100.25 |
99.79 - 100.54 |
1.0273 times |
Fri 03 October 2025 |
100.18 (0.11%) |
100.18 |
100.03 - 101.00 |
1.1335 times |
Fri 26 September 2025 |
100.07 (-0.22%) |
100.26 |
99.85 - 100.36 |
1.0816 times |
Fri 19 September 2025 |
100.29 (-0.25%) |
100.67 |
100.16 - 101.02 |
1.0691 times |
Fri 12 September 2025 |
100.54 (0.44%) |
100.33 |
100.16 - 100.78 |
1.0089 times |
Fri 05 September 2025 |
100.10 (0.64%) |
98.82 |
98.79 - 100.23 |
0.9277 times |
Fri 29 August 2025 |
99.46 (0%) |
99.47 |
99.40 - 99.54 |
0.2761 times |
Fri 29 August 2025 |
99.46 (0.06%) |
99.21 |
99.16 - 99.61 |
1.0193 times |
Fri 22 August 2025 |
99.40 (0.46%) |
98.99 |
98.73 - 99.44 |
1.2045 times |
Monthly price and charts AggregateBond Strong monthly Stock price targets for AggregateBond AGG are 100.42 and 102.13 | Monthly Target 1 | 99.07 | | Monthly Target 2 | 100.05 | | Monthly Target 3 | 100.77666666667 | | Monthly Target 4 | 101.76 | | Monthly Target 5 | 102.49 |
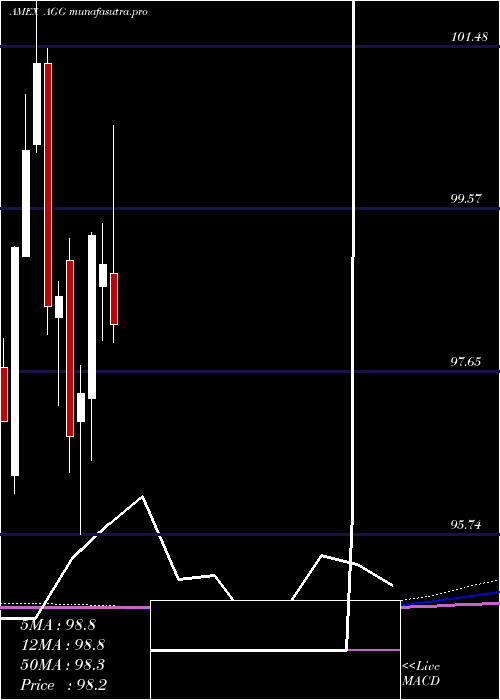
Monthly price and volumes Aggregate Bond
| Date |
Closing |
Open |
Range |
Volume |
Thu 23 October 2025 |
101.04 (0.79%) |
100.18 |
99.79 - 101.50 |
0.7825 times |
Tue 30 September 2025 |
100.25 (0.79%) |
98.82 |
98.79 - 101.02 |
0.9156 times |
Fri 29 August 2025 |
99.46 (0.85%) |
98.87 |
98.73 - 99.61 |
0.9872 times |
Thu 31 July 2025 |
98.62 (-0.58%) |
98.87 |
97.69 - 98.95 |
1.2135 times |
Mon 30 June 2025 |
99.20 (1.12%) |
97.23 |
97.23 - 99.23 |
1.064 times |
Fri 30 May 2025 |
98.10 (-0.93%) |
98.83 |
96.66 - 98.87 |
1.0223 times |
Wed 30 April 2025 |
99.02 (0.1%) |
98.81 |
96.15 - 100.55 |
1.1597 times |
Mon 31 March 2025 |
98.92 (-0.33%) |
98.66 |
98.01 - 99.40 |
0.9274 times |
Fri 28 February 2025 |
99.25 (1.9%) |
97.34 |
96.61 - 99.29 |
0.9541 times |
Fri 31 January 2025 |
97.40 (0.52%) |
97.07 |
95.74 - 97.73 |
0.9737 times |
Tue 31 December 2024 |
96.90 (-1.66%) |
98.97 |
96.47 - 99.22 |
0.9119 times |
DMA SMA EMA moving averages of Aggregate Bond AGG
DMA (daily moving average) of Aggregate Bond AGG
| DMA period | DMA value | | 5 day DMA | 101.11 | | 12 day DMA | 100.78 | | 20 day DMA | 100.54 | | 35 day DMA | 100.47 | | 50 day DMA | 100.1 | | 100 day DMA | 99.25 | | 150 day DMA | 98.84 | | 200 day DMA | 98.55 | EMA (exponential moving average) of Aggregate Bond AGG
| EMA period | EMA current | EMA prev | EMA prev2 | | 5 day EMA | 101.07 | 101.09 | 101.02 | | 12 day EMA | 100.85 | 100.82 | 100.74 | | 20 day EMA | 100.67 | 100.63 | 100.57 | | 35 day EMA | 100.37 | 100.33 | 100.28 | | 50 day EMA | 100.12 | 100.08 | 100.03 |
SMA (simple moving average) of Aggregate Bond AGG
| SMA period | SMA current | SMA prev | SMA prev2 | | 5 day SMA | 101.11 | 101.13 | 101.03 | | 12 day SMA | 100.78 | 100.71 | 100.6 | | 20 day SMA | 100.54 | 100.48 | 100.43 | | 35 day SMA | 100.47 | 100.43 | 100.37 | | 50 day SMA | 100.1 | 100.06 | 100.02 | | 100 day SMA | 99.25 | 99.22 | 99.19 | | 150 day SMA | 98.84 | 98.83 | 98.81 | | 200 day SMA | 98.55 | 98.53 | 98.5 |
|
|
