FtActive AFSM full analysis,charts,indicators,moving averages,SMA,DMA,EMA,ADX,MACD,RSIFt Active AFSM WideScreen charts, DMA,SMA,EMA technical analysis, forecast prediction, by indicators ADX,MACD,RSI,CCI AMEX stock exchange
Daily price and charts and targets FtActive Strong Daily Stock price targets for FtActive AFSM are 32.73 and 32.91 | Daily Target 1 | 32.7 | | Daily Target 2 | 32.76 | | Daily Target 3 | 32.88 | | Daily Target 4 | 32.94 | | Daily Target 5 | 33.06 |
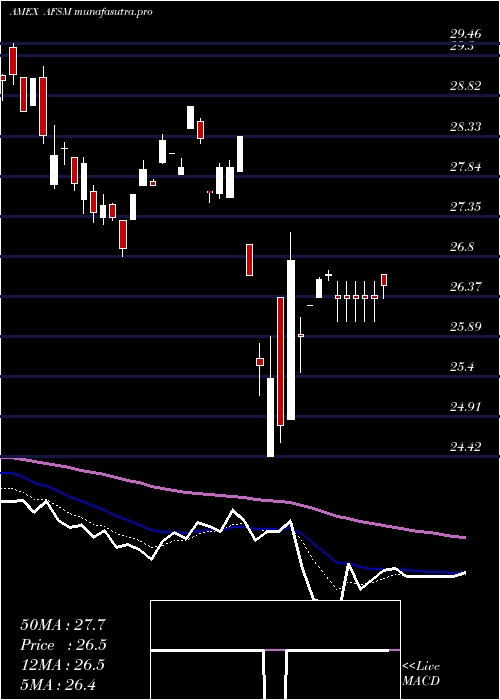
Daily price and volume Ft Active
| Date |
Closing |
Open |
Range |
Volume |
Fri 24 October 2025 |
32.82 (0.92%) |
33.00 |
32.82 - 33.00 |
1.011 times |
Thu 23 October 2025 |
32.52 (1.47%) |
32.31 |
32.31 - 32.58 |
0.4575 times |
Wed 22 October 2025 |
32.05 (-0.65%) |
32.28 |
31.81 - 32.28 |
0.7464 times |
Tue 21 October 2025 |
32.26 (0.22%) |
32.21 |
32.21 - 32.32 |
0.5679 times |
Mon 20 October 2025 |
32.19 (1.55%) |
32.06 |
32.02 - 32.19 |
0.656 times |
Fri 17 October 2025 |
31.70 (-0.22%) |
31.78 |
31.67 - 31.78 |
0.2341 times |
Thu 16 October 2025 |
31.77 (-1.46%) |
32.23 |
31.65 - 32.23 |
1.7993 times |
Wed 15 October 2025 |
32.24 (0.5%) |
32.42 |
32.11 - 32.42 |
3.2515 times |
Tue 14 October 2025 |
32.08 (1.39%) |
31.46 |
31.46 - 32.17 |
0.8342 times |
Mon 13 October 2025 |
31.64 (1.67%) |
31.58 |
31.45 - 31.64 |
0.4422 times |
Fri 10 October 2025 |
31.12 (-3.11%) |
31.61 |
31.11 - 31.61 |
0.6835 times |
Weekly price and charts FtActive Strong weekly Stock price targets for FtActive AFSM are 32.32 and 33.51 | Weekly Target 1 | 31.35 | | Weekly Target 2 | 32.09 | | Weekly Target 3 | 32.543333333333 | | Weekly Target 4 | 33.28 | | Weekly Target 5 | 33.73 |
Weekly price and volumes for Ft Active
| Date |
Closing |
Open |
Range |
Volume |
Fri 24 October 2025 |
32.82 (3.53%) |
32.06 |
31.81 - 33.00 |
0.8457 times |
Fri 17 October 2025 |
31.70 (1.86%) |
31.58 |
31.45 - 32.42 |
1.6137 times |
Fri 10 October 2025 |
31.12 (-4.69%) |
32.97 |
31.11 - 32.97 |
3.1463 times |
Fri 03 October 2025 |
32.65 (-0.46%) |
32.91 |
32.36 - 32.94 |
0.365 times |
Fri 26 September 2025 |
32.80 (-0.67%) |
33.15 |
32.39 - 33.52 |
0.576 times |
Fri 19 September 2025 |
33.02 (0.64%) |
32.93 |
32.61 - 33.46 |
0.3535 times |
Fri 12 September 2025 |
32.81 (0.18%) |
32.75 |
32.45 - 33.14 |
0.791 times |
Fri 05 September 2025 |
32.75 (1.27%) |
31.95 |
31.85 - 32.95 |
0.288 times |
Fri 29 August 2025 |
32.34 (0%) |
32.32 |
32.24 - 32.40 |
0.0853 times |
Fri 29 August 2025 |
32.34 (0.03%) |
32.25 |
32.05 - 32.49 |
1.9355 times |
Fri 22 August 2025 |
32.33 (3.62%) |
31.41 |
31.04 - 32.41 |
0.8392 times |

Monthly price and charts FtActive Strong monthly Stock price targets for FtActive AFSM are 31.97 and 33.86 | Monthly Target 1 | 30.42 | | Monthly Target 2 | 31.62 | | Monthly Target 3 | 32.31 | | Monthly Target 4 | 33.51 | | Monthly Target 5 | 34.2 |
Monthly price and volumes Ft Active
| Date |
Closing |
Open |
Range |
Volume |
Fri 24 October 2025 |
32.82 (0.34%) |
32.68 |
31.11 - 33.00 |
2.0261 times |
Tue 30 September 2025 |
32.71 (1.14%) |
31.95 |
31.85 - 33.52 |
0.7618 times |
Fri 29 August 2025 |
32.34 (7.48%) |
29.49 |
29.49 - 32.49 |
1.27 times |
Thu 31 July 2025 |
30.09 (0.7%) |
29.81 |
29.70 - 30.83 |
1.1777 times |
Mon 30 June 2025 |
29.88 (2.79%) |
28.94 |
28.89 - 30.07 |
0.8637 times |
Fri 30 May 2025 |
29.07 (5.44%) |
27.70 |
27.63 - 29.59 |
0.5813 times |
Wed 30 April 2025 |
27.57 (-1.36%) |
27.58 |
24.42 - 28.32 |
1.3448 times |
Mon 31 March 2025 |
27.95 (-3.72%) |
29.04 |
26.86 - 29.18 |
0.5954 times |
Fri 28 February 2025 |
29.03 (-5.96%) |
29.89 |
28.63 - 31.34 |
0.6732 times |
Fri 31 January 2025 |
30.87 (2.63%) |
30.37 |
29.20 - 31.42 |
0.706 times |
Tue 31 December 2024 |
30.08 (-8.63%) |
33.14 |
29.62 - 33.14 |
0.8927 times |

DMA SMA EMA moving averages of Ft Active AFSM
DMA (daily moving average) of Ft Active AFSM
| DMA period | DMA value | | 5 day DMA | 32.37 | | 12 day DMA | 32.04 | | 20 day DMA | 32.26 | | 35 day DMA | 32.52 | | 50 day DMA | 32.39 | | 100 day DMA | 31.22 | | 150 day DMA | 30.06 | | 200 day DMA | 29.95 | EMA (exponential moving average) of Ft Active AFSM
| EMA period | EMA current | EMA prev | EMA prev2 | | 5 day EMA | 32.41 | 32.21 | 32.06 | | 12 day EMA | 32.26 | 32.16 | 32.1 | | 20 day EMA | 32.28 | 32.22 | 32.19 | | 35 day EMA | 32.23 | 32.2 | 32.18 | | 50 day EMA | 32.29 | 32.27 | 32.26 |
SMA (simple moving average) of Ft Active AFSM
| SMA period | SMA current | SMA prev | SMA prev2 | | 5 day SMA | 32.37 | 32.14 | 31.99 | | 12 day SMA | 32.04 | 32.01 | 31.98 | | 20 day SMA | 32.26 | 32.26 | 32.25 | | 35 day SMA | 32.52 | 32.52 | 32.52 | | 50 day SMA | 32.39 | 32.35 | 32.33 | | 100 day SMA | 31.22 | 31.19 | 31.15 | | 150 day SMA | 30.06 | 30.02 | 29.99 | | 200 day SMA | 29.95 | 29.93 | 29.92 |
|
|
