FtActive AFLG full analysis,charts,indicators,moving averages,SMA,DMA,EMA,ADX,MACD,RSIFt Active AFLG WideScreen charts, DMA,SMA,EMA technical analysis, forecast prediction, by indicators ADX,MACD,RSI,CCI AMEX stock exchange
Daily price and charts and targets FtActive Strong Daily Stock price targets for FtActive AFLG are 39.07 and 39.18 | Daily Target 1 | 39.05 | | Daily Target 2 | 39.08 | | Daily Target 3 | 39.156666666667 | | Daily Target 4 | 39.19 | | Daily Target 5 | 39.27 |
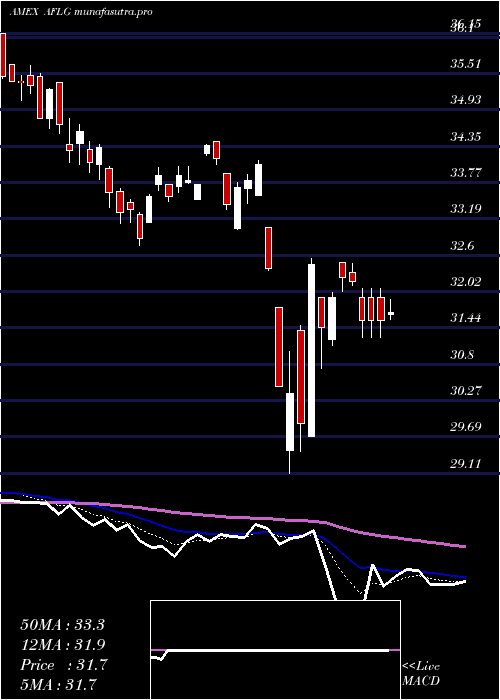
Daily price and volume Ft Active
| Date |
Closing |
Open |
Range |
Volume |
Fri 24 October 2025 |
39.12 (0.72%) |
39.19 |
39.12 - 39.23 |
0.5377 times |
Thu 23 October 2025 |
38.84 (0.6%) |
38.70 |
38.68 - 38.93 |
0.8998 times |
Wed 22 October 2025 |
38.61 (-0.69%) |
38.84 |
38.42 - 38.86 |
0.5707 times |
Tue 21 October 2025 |
38.88 (0.03%) |
38.86 |
38.73 - 38.93 |
0.7888 times |
Mon 20 October 2025 |
38.87 (0.83%) |
38.70 |
38.70 - 38.92 |
0.8723 times |
Fri 17 October 2025 |
38.55 (0.55%) |
38.30 |
38.25 - 38.60 |
0.8445 times |
Thu 16 October 2025 |
38.34 (-0.78%) |
38.76 |
38.16 - 38.76 |
0.5691 times |
Wed 15 October 2025 |
38.64 (0.29%) |
38.81 |
38.36 - 38.91 |
0.7365 times |
Tue 14 October 2025 |
38.53 (0.31%) |
37.99 |
37.99 - 38.70 |
3.603 times |
Mon 13 October 2025 |
38.41 (1.35%) |
38.30 |
38.23 - 38.49 |
0.5776 times |
Fri 10 October 2025 |
37.90 (-2.4%) |
38.85 |
37.87 - 38.99 |
1.6372 times |
Weekly price and charts FtActive Strong weekly Stock price targets for FtActive AFLG are 38.77 and 39.58 | Weekly Target 1 | 38.11 | | Weekly Target 2 | 38.62 | | Weekly Target 3 | 38.923333333333 | | Weekly Target 4 | 39.43 | | Weekly Target 5 | 39.73 |
Weekly price and volumes for Ft Active
| Date |
Closing |
Open |
Range |
Volume |
Fri 24 October 2025 |
39.12 (1.48%) |
38.70 |
38.42 - 39.23 |
0.9102 times |
Fri 17 October 2025 |
38.55 (1.72%) |
38.30 |
37.99 - 38.91 |
1.5703 times |
Fri 10 October 2025 |
37.90 (-2.87%) |
39.14 |
37.87 - 39.14 |
1.1917 times |
Fri 03 October 2025 |
39.02 (1.09%) |
38.83 |
38.60 - 39.23 |
1.0919 times |
Fri 26 September 2025 |
38.60 (0.16%) |
38.46 |
38.11 - 38.80 |
0.9904 times |
Fri 19 September 2025 |
38.54 (0.68%) |
38.33 |
38.06 - 38.55 |
1.3518 times |
Fri 12 September 2025 |
38.28 (1.06%) |
38.02 |
37.84 - 38.46 |
1.14 times |
Fri 05 September 2025 |
37.88 (0.58%) |
37.17 |
37.17 - 38.11 |
0.5292 times |
Fri 29 August 2025 |
37.66 (0%) |
37.80 |
37.54 - 37.80 |
0.1827 times |
Fri 29 August 2025 |
37.66 (-0.08%) |
37.66 |
37.51 - 37.82 |
1.0419 times |
Fri 22 August 2025 |
37.69 (0.53%) |
37.49 |
37.07 - 37.82 |
1.5309 times |

Monthly price and charts FtActive Strong monthly Stock price targets for FtActive AFLG are 38.5 and 39.86 | Monthly Target 1 | 37.38 | | Monthly Target 2 | 38.25 | | Monthly Target 3 | 38.74 | | Monthly Target 4 | 39.61 | | Monthly Target 5 | 40.1 |
Monthly price and volumes Ft Active
| Date |
Closing |
Open |
Range |
Volume |
Fri 24 October 2025 |
39.12 (0.8%) |
38.69 |
37.87 - 39.23 |
0.5908 times |
Tue 30 September 2025 |
38.81 (3.05%) |
37.17 |
37.17 - 38.83 |
0.6 times |
Fri 29 August 2025 |
37.66 (2.36%) |
36.50 |
36.23 - 37.82 |
0.7829 times |
Thu 31 July 2025 |
36.79 (1.32%) |
36.19 |
35.95 - 37.17 |
1.0746 times |
Mon 30 June 2025 |
36.31 (3.62%) |
35.00 |
34.78 - 36.34 |
0.7326 times |
Fri 30 May 2025 |
35.04 (5.38%) |
33.52 |
33.35 - 35.53 |
1.2705 times |
Wed 30 April 2025 |
33.25 (-1.31%) |
33.67 |
29.11 - 34.12 |
1.3112 times |
Mon 31 March 2025 |
33.69 (-4.45%) |
35.37 |
32.76 - 35.37 |
1.1796 times |
Fri 28 February 2025 |
35.26 (-0.68%) |
35.09 |
34.63 - 36.23 |
1.0608 times |
Fri 31 January 2025 |
35.50 (2.81%) |
34.77 |
34.10 - 36.04 |
1.397 times |
Tue 31 December 2024 |
34.53 (-4.51%) |
36.17 |
34.39 - 36.53 |
1.5894 times |

DMA SMA EMA moving averages of Ft Active AFLG
DMA (daily moving average) of Ft Active AFLG
| DMA period | DMA value | | 5 day DMA | 38.86 | | 12 day DMA | 38.63 | | 20 day DMA | 38.75 | | 35 day DMA | 38.57 | | 50 day DMA | 38.28 | | 100 day DMA | 37.31 | | 150 day DMA | 36 | | 200 day DMA | 35.76 | EMA (exponential moving average) of Ft Active AFLG
| EMA period | EMA current | EMA prev | EMA prev2 | | 5 day EMA | 38.86 | 38.73 | 38.68 | | 12 day EMA | 38.75 | 38.68 | 38.65 | | 20 day EMA | 38.67 | 38.62 | 38.6 | | 35 day EMA | 38.48 | 38.44 | 38.42 | | 50 day EMA | 38.27 | 38.24 | 38.22 |
SMA (simple moving average) of Ft Active AFLG
| SMA period | SMA current | SMA prev | SMA prev2 | | 5 day SMA | 38.86 | 38.75 | 38.65 | | 12 day SMA | 38.63 | 38.62 | 38.63 | | 20 day SMA | 38.75 | 38.72 | 38.69 | | 35 day SMA | 38.57 | 38.54 | 38.51 | | 50 day SMA | 38.28 | 38.24 | 38.22 | | 100 day SMA | 37.31 | 37.27 | 37.23 | | 150 day SMA | 36 | 35.97 | 35.93 | | 200 day SMA | 35.76 | 35.74 | 35.72 |
|
|
