AfricaIndex AFK full analysis,charts,indicators,moving averages,SMA,DMA,EMA,ADX,MACD,RSIAfrica Index AFK WideScreen charts, DMA,SMA,EMA technical analysis, forecast prediction, by indicators ADX,MACD,RSI,CCI AMEX stock exchange
Daily price and charts and targets AfricaIndex Strong Daily Stock price targets for AfricaIndex AFK are 24.06 and 24.36 | Daily Target 1 | 23.81 | | Daily Target 2 | 24 | | Daily Target 3 | 24.106666666667 | | Daily Target 4 | 24.3 | | Daily Target 5 | 24.41 |
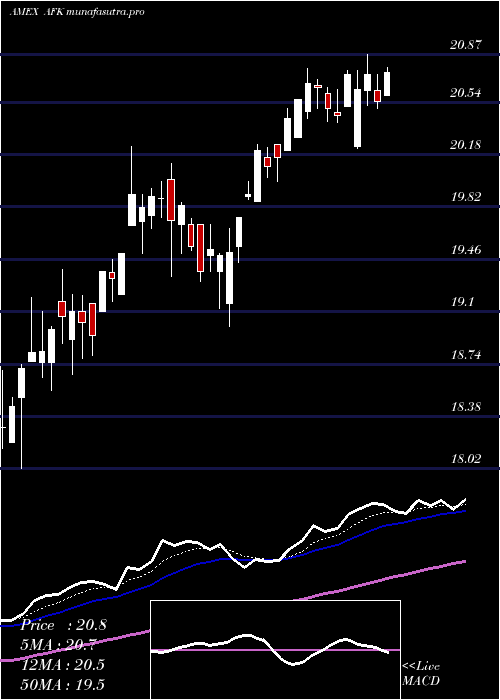
Daily price and volume Africa Index
| Date |
Closing |
Open |
Range |
Volume |
Thu 23 October 2025 |
24.20 (1.34%) |
24.10 |
23.91 - 24.21 |
0.2093 times |
Wed 22 October 2025 |
23.88 (-0.67%) |
24.13 |
23.31 - 24.20 |
1.8953 times |
Tue 21 October 2025 |
24.04 (-2.63%) |
24.50 |
23.70 - 24.50 |
1.0959 times |
Mon 20 October 2025 |
24.69 (1.44%) |
24.65 |
24.51 - 24.70 |
0.2592 times |
Fri 17 October 2025 |
24.34 (-1.78%) |
24.75 |
24.16 - 24.75 |
0.7048 times |
Thu 16 October 2025 |
24.78 (0.53%) |
24.66 |
24.51 - 25.00 |
0.6395 times |
Wed 15 October 2025 |
24.65 (0.37%) |
24.48 |
24.48 - 24.83 |
0.2525 times |
Tue 14 October 2025 |
24.56 (0.16%) |
24.36 |
24.06 - 24.85 |
0.4458 times |
Mon 13 October 2025 |
24.52 (3.46%) |
24.49 |
24.15 - 24.60 |
2.0094 times |
Fri 10 October 2025 |
23.70 (-3.27%) |
24.46 |
23.70 - 24.57 |
2.488 times |
Thu 09 October 2025 |
24.50 (-1.65%) |
24.85 |
24.36 - 24.89 |
0.5456 times |
Weekly price and charts AfricaIndex Strong weekly Stock price targets for AfricaIndex AFK are 23.06 and 24.45 | Weekly Target 1 | 22.68 | | Weekly Target 2 | 23.44 | | Weekly Target 3 | 24.07 | | Weekly Target 4 | 24.83 | | Weekly Target 5 | 25.46 |
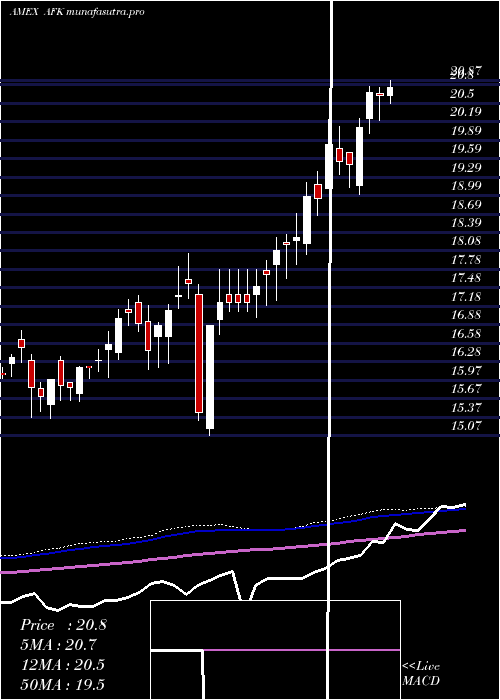
Weekly price and volumes for Africa Index
| Date |
Closing |
Open |
Range |
Volume |
Thu 23 October 2025 |
24.20 (-0.58%) |
24.65 |
23.31 - 24.70 |
1.0097 times |
Fri 17 October 2025 |
24.34 (2.7%) |
24.49 |
24.06 - 25.00 |
1.1826 times |
Fri 10 October 2025 |
23.70 (-3.7%) |
24.92 |
23.70 - 25.00 |
1.2572 times |
Fri 03 October 2025 |
24.61 (2.37%) |
24.27 |
24.01 - 24.75 |
1.2429 times |
Fri 26 September 2025 |
24.04 (0.84%) |
23.52 |
23.50 - 24.35 |
1.409 times |
Fri 19 September 2025 |
23.84 (1.75%) |
23.43 |
23.01 - 23.84 |
1.0555 times |
Fri 12 September 2025 |
23.43 (3.67%) |
22.63 |
22.63 - 23.65 |
0.9099 times |
Fri 05 September 2025 |
22.60 (0.8%) |
22.39 |
22.20 - 22.91 |
0.9086 times |
Fri 29 August 2025 |
22.42 (0%) |
22.30 |
22.21 - 22.42 |
0.0405 times |
Fri 29 August 2025 |
22.42 (0.99%) |
22.30 |
22.12 - 22.55 |
0.9841 times |
Fri 22 August 2025 |
22.20 (1.56%) |
21.88 |
21.12 - 22.21 |
0.5246 times |
Monthly price and charts AfricaIndex Strong monthly Stock price targets for AfricaIndex AFK are 22.91 and 24.6 | Monthly Target 1 | 22.48 | | Monthly Target 2 | 23.34 | | Monthly Target 3 | 24.17 | | Monthly Target 4 | 25.03 | | Monthly Target 5 | 25.86 |
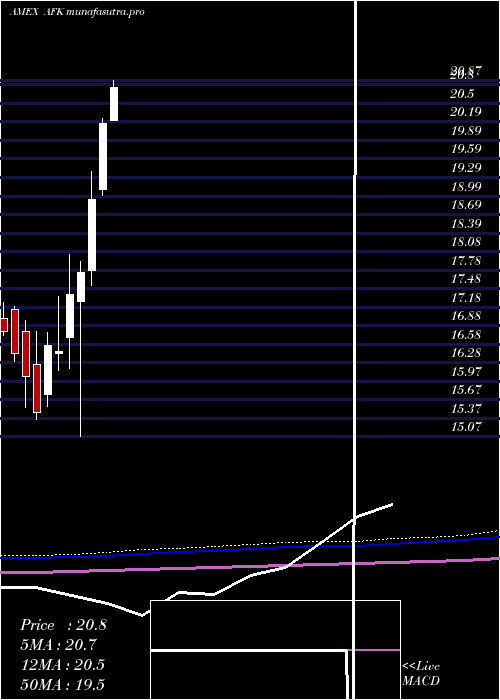
Monthly price and volumes Africa Index
| Date |
Closing |
Open |
Range |
Volume |
Thu 23 October 2025 |
24.20 (-0.7%) |
24.36 |
23.31 - 25.00 |
1.6973 times |
Tue 30 September 2025 |
24.37 (8.7%) |
22.39 |
22.20 - 24.47 |
2.0166 times |
Fri 29 August 2025 |
22.42 (7.07%) |
20.88 |
20.75 - 22.55 |
1.1743 times |
Thu 31 July 2025 |
20.94 (3.87%) |
20.21 |
20.21 - 21.87 |
1.0067 times |
Mon 30 June 2025 |
20.16 (6.44%) |
19.10 |
19.00 - 20.25 |
0.7233 times |
Fri 30 May 2025 |
18.94 (6.7%) |
17.77 |
17.54 - 19.39 |
0.8596 times |
Wed 30 April 2025 |
17.75 (2.07%) |
17.27 |
15.07 - 17.92 |
0.8593 times |
Mon 31 March 2025 |
17.39 (5.65%) |
16.69 |
16.18 - 18.04 |
0.6991 times |
Fri 28 February 2025 |
16.46 (-0.54%) |
16.42 |
16.15 - 17.35 |
0.4697 times |
Fri 31 January 2025 |
16.55 (6.98%) |
15.76 |
15.57 - 16.76 |
0.4942 times |
Tue 31 December 2024 |
15.47 (-3.67%) |
16.25 |
15.35 - 16.78 |
0.4534 times |
DMA SMA EMA moving averages of Africa Index AFK
DMA (daily moving average) of Africa Index AFK
| DMA period | DMA value | | 5 day DMA | 24.23 | | 12 day DMA | 24.4 | | 20 day DMA | 24.41 | | 35 day DMA | 23.97 | | 50 day DMA | 23.42 | | 100 day DMA | 22 | | 150 day DMA | 20.57 | | 200 day DMA | 19.6 | EMA (exponential moving average) of Africa Index AFK
| EMA period | EMA current | EMA prev | EMA prev2 | | 5 day EMA | 24.21 | 24.22 | 24.39 | | 12 day EMA | 24.31 | 24.33 | 24.41 | | 20 day EMA | 24.23 | 24.23 | 24.27 | | 35 day EMA | 23.82 | 23.8 | 23.8 | | 50 day EMA | 23.37 | 23.34 | 23.32 |
SMA (simple moving average) of Africa Index AFK
| SMA period | SMA current | SMA prev | SMA prev2 | | 5 day SMA | 24.23 | 24.35 | 24.5 | | 12 day SMA | 24.4 | 24.44 | 24.52 | | 20 day SMA | 24.41 | 24.38 | 24.38 | | 35 day SMA | 23.97 | 23.92 | 23.88 | | 50 day SMA | 23.42 | 23.37 | 23.33 | | 100 day SMA | 22 | 21.95 | 21.9 | | 150 day SMA | 20.57 | 20.53 | 20.48 | | 200 day SMA | 19.6 | 19.55 | 19.51 |
|
|
