AberdeenEm AEF full analysis,charts,indicators,moving averages,SMA,DMA,EMA,ADX,MACD,RSIAberdeen Em AEF WideScreen charts, DMA,SMA,EMA technical analysis, forecast prediction, by indicators ADX,MACD,RSI,CCI AMEX stock exchange
Daily price and charts and targets AberdeenEm Strong Daily Stock price targets for AberdeenEm AEF are 6.65 and 6.72 | Daily Target 1 | 6.6 | | Daily Target 2 | 6.63 | | Daily Target 3 | 6.6666666666667 | | Daily Target 4 | 6.7 | | Daily Target 5 | 6.74 |
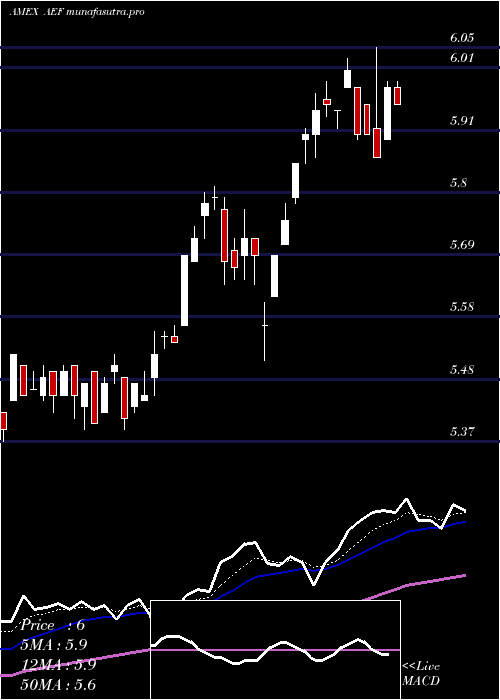
Daily price and volume Aberdeen Em
| Date |
Closing |
Open |
Range |
Volume |
Thu 23 October 2025 |
6.67 (0.45%) |
6.64 |
6.63 - 6.70 |
0.6146 times |
Wed 22 October 2025 |
6.64 (0.3%) |
6.63 |
6.61 - 6.71 |
0.6321 times |
Tue 21 October 2025 |
6.62 (-0.6%) |
6.69 |
6.55 - 6.69 |
0.6331 times |
Mon 20 October 2025 |
6.66 (1.22%) |
6.59 |
6.58 - 6.70 |
0.86 times |
Fri 17 October 2025 |
6.58 (-0.3%) |
6.58 |
6.56 - 6.64 |
0.5389 times |
Thu 16 October 2025 |
6.60 (-0.15%) |
6.66 |
6.59 - 6.67 |
0.8146 times |
Wed 15 October 2025 |
6.61 (1.69%) |
6.57 |
6.57 - 6.63 |
2.1529 times |
Tue 14 October 2025 |
6.50 (-0.15%) |
6.51 |
6.45 - 6.51 |
1.4497 times |
Mon 13 October 2025 |
6.51 (3.5%) |
6.39 |
6.39 - 6.51 |
0.8598 times |
Fri 10 October 2025 |
6.29 (-3.53%) |
6.56 |
6.26 - 6.56 |
1.4445 times |
Thu 09 October 2025 |
6.52 (-0.31%) |
6.54 |
6.48 - 6.58 |
0.7214 times |
Weekly price and charts AberdeenEm Strong weekly Stock price targets for AberdeenEm AEF are 6.61 and 6.77 | Weekly Target 1 | 6.48 | | Weekly Target 2 | 6.58 | | Weekly Target 3 | 6.6433333333333 | | Weekly Target 4 | 6.74 | | Weekly Target 5 | 6.8 |
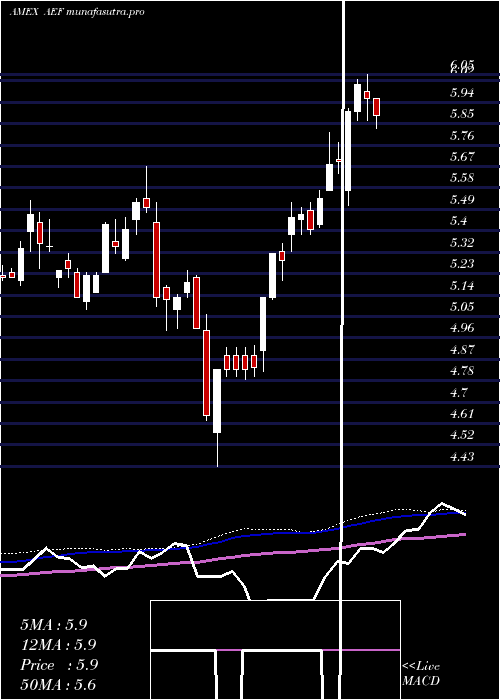
Weekly price and volumes for Aberdeen Em
| Date |
Closing |
Open |
Range |
Volume |
Thu 23 October 2025 |
6.67 (1.37%) |
6.59 |
6.55 - 6.71 |
0.6624 times |
Fri 17 October 2025 |
6.58 (4.61%) |
6.39 |
6.39 - 6.67 |
1.406 times |
Fri 10 October 2025 |
6.29 (-3.38%) |
6.59 |
6.26 - 6.61 |
1.1811 times |
Fri 03 October 2025 |
6.51 (3.66%) |
6.33 |
6.33 - 6.61 |
1.266 times |
Fri 26 September 2025 |
6.28 (-3.68%) |
6.48 |
6.25 - 6.51 |
1.212 times |
Fri 19 September 2025 |
6.52 (1.24%) |
6.50 |
6.48 - 6.59 |
1.4086 times |
Fri 12 September 2025 |
6.44 (4.04%) |
6.24 |
6.20 - 6.48 |
0.8519 times |
Fri 05 September 2025 |
6.19 (1.31%) |
6.05 |
6.04 - 6.22 |
0.7838 times |
Fri 29 August 2025 |
6.11 (0%) |
6.20 |
6.08 - 6.20 |
0.2417 times |
Fri 29 August 2025 |
6.11 (-0.16%) |
6.11 |
6.08 - 6.24 |
0.9864 times |
Fri 22 August 2025 |
6.12 (-0.97%) |
6.20 |
6.00 - 6.22 |
1.1803 times |
Monthly price and charts AberdeenEm Strong monthly Stock price targets for AberdeenEm AEF are 6.47 and 6.92 | Monthly Target 1 | 6.1 | | Monthly Target 2 | 6.38 | | Monthly Target 3 | 6.5466666666667 | | Monthly Target 4 | 6.83 | | Monthly Target 5 | 7 |
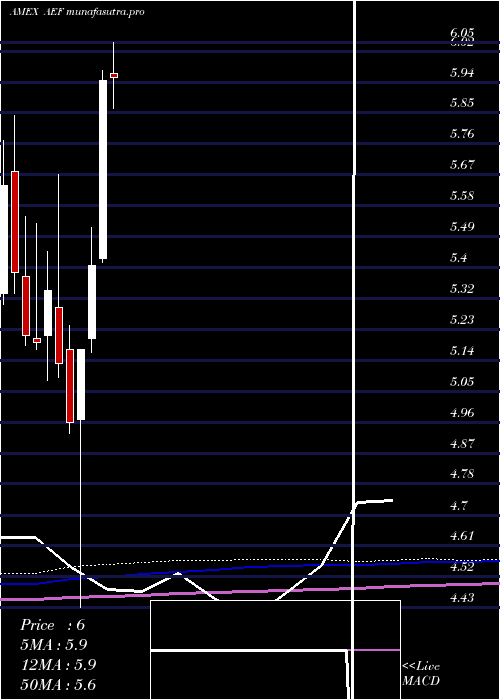
Monthly price and volumes Aberdeen Em
| Date |
Closing |
Open |
Range |
Volume |
Thu 23 October 2025 |
6.67 (2.93%) |
6.49 |
6.26 - 6.71 |
0.5139 times |
Tue 30 September 2025 |
6.48 (6.06%) |
6.05 |
6.04 - 6.59 |
0.6586 times |
Fri 29 August 2025 |
6.11 (1.16%) |
6.03 |
5.96 - 6.24 |
0.6418 times |
Thu 31 July 2025 |
6.04 (1.68%) |
5.96 |
5.83 - 6.22 |
1.1538 times |
Mon 30 June 2025 |
5.94 (9.8%) |
5.43 |
5.42 - 5.97 |
0.6641 times |
Fri 30 May 2025 |
5.41 (4.64%) |
5.20 |
5.16 - 5.52 |
0.6965 times |
Wed 30 April 2025 |
5.17 (4.23%) |
4.97 |
4.43 - 5.17 |
1.1891 times |
Mon 31 March 2025 |
4.96 (-3.31%) |
5.17 |
4.93 - 5.24 |
1.6522 times |
Fri 28 February 2025 |
5.13 (-3.93%) |
5.29 |
5.09 - 5.67 |
1.6249 times |
Fri 31 January 2025 |
5.34 (2.89%) |
5.21 |
5.08 - 5.45 |
1.2052 times |
Tue 31 December 2024 |
5.19 (-0.38%) |
5.20 |
5.17 - 5.53 |
0.7532 times |
DMA SMA EMA moving averages of Aberdeen Em AEF
DMA (daily moving average) of Aberdeen Em AEF
| DMA period | DMA value | | 5 day DMA | 6.63 | | 12 day DMA | 6.56 | | 20 day DMA | 6.53 | | 35 day DMA | 6.47 | | 50 day DMA | 6.37 | | 100 day DMA | 6.13 | | 150 day DMA | 5.79 | | 200 day DMA | 5.67 | EMA (exponential moving average) of Aberdeen Em AEF
| EMA period | EMA current | EMA prev | EMA prev2 | | 5 day EMA | 6.63 | 6.61 | 6.6 | | 12 day EMA | 6.58 | 6.56 | 6.55 | | 20 day EMA | 6.54 | 6.53 | 6.52 | | 35 day EMA | 6.44 | 6.43 | 6.42 | | 50 day EMA | 6.37 | 6.36 | 6.35 |
SMA (simple moving average) of Aberdeen Em AEF
| SMA period | SMA current | SMA prev | SMA prev2 | | 5 day SMA | 6.63 | 6.62 | 6.61 | | 12 day SMA | 6.56 | 6.55 | 6.54 | | 20 day SMA | 6.53 | 6.51 | 6.5 | | 35 day SMA | 6.47 | 6.46 | 6.44 | | 50 day SMA | 6.37 | 6.36 | 6.35 | | 100 day SMA | 6.13 | 6.12 | 6.11 | | 150 day SMA | 5.79 | 5.78 | 5.77 | | 200 day SMA | 5.67 | 5.66 | 5.65 |
|
|
