AmericanConservative ACVF full analysis,charts,indicators,moving averages,SMA,DMA,EMA,ADX,MACD,RSIAmerican Conservative ACVF WideScreen charts, DMA,SMA,EMA technical analysis, forecast prediction, by indicators ADX,MACD,RSI,CCI AMEX stock exchange
Daily price and charts and targets AmericanConservative Strong Daily Stock price targets for AmericanConservative ACVF are 49.23 and 49.91 | Daily Target 1 | 48.68 | | Daily Target 2 | 49.1 | | Daily Target 3 | 49.363333333333 | | Daily Target 4 | 49.78 | | Daily Target 5 | 50.04 |
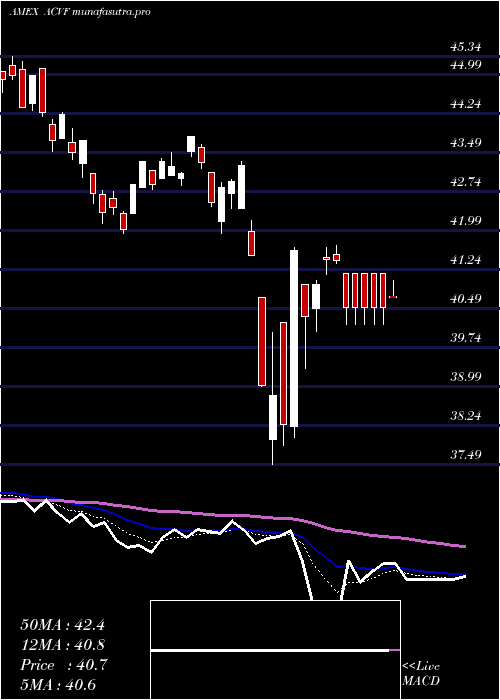
Daily price and volume American Conservative
| Date |
Closing |
Open |
Range |
Volume |
Thu 23 October 2025 |
49.51 (0.49%) |
48.95 |
48.95 - 49.63 |
0.864 times |
Wed 22 October 2025 |
49.27 (-0.34%) |
49.64 |
49.09 - 49.64 |
1.2006 times |
Tue 21 October 2025 |
49.44 (0.06%) |
49.46 |
49.44 - 49.57 |
0.5279 times |
Mon 20 October 2025 |
49.41 (0.67%) |
49.39 |
49.33 - 49.47 |
0.7308 times |
Fri 17 October 2025 |
49.08 (0.43%) |
48.94 |
48.80 - 49.13 |
1.4451 times |
Thu 16 October 2025 |
48.87 (-0.61%) |
49.23 |
48.75 - 49.23 |
1.5159 times |
Wed 15 October 2025 |
49.17 (0.06%) |
49.49 |
48.92 - 49.55 |
0.8122 times |
Tue 14 October 2025 |
49.14 (0.1%) |
48.77 |
48.77 - 49.37 |
0.7716 times |
Mon 13 October 2025 |
49.09 (1.26%) |
48.90 |
48.90 - 49.14 |
1.4416 times |
Fri 10 October 2025 |
48.48 (-2.18%) |
49.61 |
48.48 - 49.70 |
0.6904 times |
Thu 09 October 2025 |
49.56 (-0.42%) |
49.83 |
49.52 - 49.83 |
0.731 times |
Weekly price and charts AmericanConservative Strong weekly Stock price targets for AmericanConservative ACVF are 49.23 and 49.92 | Weekly Target 1 | 48.68 | | Weekly Target 2 | 49.09 | | Weekly Target 3 | 49.366666666667 | | Weekly Target 4 | 49.78 | | Weekly Target 5 | 50.06 |
Weekly price and volumes for American Conservative
| Date |
Closing |
Open |
Range |
Volume |
Thu 23 October 2025 |
49.51 (0.88%) |
49.39 |
48.95 - 49.64 |
0.537 times |
Fri 17 October 2025 |
49.08 (1.24%) |
48.90 |
48.75 - 49.55 |
0.9674 times |
Fri 10 October 2025 |
48.48 (-2.2%) |
49.89 |
48.48 - 49.91 |
1.1366 times |
Fri 03 October 2025 |
49.57 (1.27%) |
49.08 |
49.05 - 49.82 |
1.328 times |
Fri 26 September 2025 |
48.95 (-0.57%) |
49.13 |
48.58 - 49.48 |
1.8539 times |
Fri 19 September 2025 |
49.23 (0.61%) |
48.98 |
48.84 - 49.28 |
0.6333 times |
Fri 12 September 2025 |
48.93 (1.45%) |
48.22 |
48.22 - 49.26 |
1.3781 times |
Fri 05 September 2025 |
48.23 (-0.35%) |
47.98 |
47.82 - 48.70 |
1.1222 times |
Fri 29 August 2025 |
48.40 (0%) |
48.67 |
48.31 - 48.67 |
0.1148 times |
Fri 29 August 2025 |
48.40 (-0.31%) |
48.53 |
48.19 - 48.74 |
0.9286 times |
Fri 22 August 2025 |
48.55 (0.66%) |
48.22 |
47.41 - 48.70 |
0.9417 times |

Monthly price and charts AmericanConservative Strong monthly Stock price targets for AmericanConservative ACVF are 49 and 50.43 | Monthly Target 1 | 47.87 | | Monthly Target 2 | 48.69 | | Monthly Target 3 | 49.3 | | Monthly Target 4 | 50.12 | | Monthly Target 5 | 50.73 |
Monthly price and volumes American Conservative
| Date |
Closing |
Open |
Range |
Volume |
Thu 23 October 2025 |
49.51 (0.41%) |
49.25 |
48.48 - 49.91 |
0.6318 times |
Tue 30 September 2025 |
49.31 (1.88%) |
47.98 |
47.82 - 49.48 |
1.1505 times |
Fri 29 August 2025 |
48.40 (1.53%) |
47.45 |
47.03 - 48.74 |
0.7032 times |
Thu 31 July 2025 |
47.67 (1.08%) |
47.12 |
46.99 - 48.37 |
0.9524 times |
Mon 30 June 2025 |
47.16 (4.52%) |
44.90 |
44.89 - 47.16 |
0.5204 times |
Fri 30 May 2025 |
45.12 (5.52%) |
43.09 |
42.84 - 45.69 |
0.7208 times |
Wed 30 April 2025 |
42.76 (-0.14%) |
42.69 |
37.49 - 43.31 |
1.5063 times |
Mon 31 March 2025 |
42.82 (-4.78%) |
45.10 |
41.93 - 45.10 |
1.0982 times |
Fri 28 February 2025 |
44.97 (0.29%) |
44.21 |
44.04 - 46.07 |
0.937 times |
Fri 31 January 2025 |
44.84 (2.56%) |
43.97 |
43.09 - 45.92 |
1.7795 times |
Tue 31 December 2024 |
43.72 (-4.67%) |
45.86 |
43.50 - 46.10 |
0.9071 times |

DMA SMA EMA moving averages of American Conservative ACVF
DMA (daily moving average) of American Conservative ACVF
| DMA period | DMA value | | 5 day DMA | 49.34 | | 12 day DMA | 49.23 | | 20 day DMA | 49.29 | | 35 day DMA | 49.12 | | 50 day DMA | 48.88 | | 100 day DMA | 47.98 | | 150 day DMA | 46.22 | | 200 day DMA | 45.79 | EMA (exponential moving average) of American Conservative ACVF
| EMA period | EMA current | EMA prev | EMA prev2 | | 5 day EMA | 49.35 | 49.27 | 49.27 | | 12 day EMA | 49.28 | 49.24 | 49.24 | | 20 day EMA | 49.23 | 49.2 | 49.19 | | 35 day EMA | 49.06 | 49.03 | 49.02 | | 50 day EMA | 48.88 | 48.85 | 48.83 |
SMA (simple moving average) of American Conservative ACVF
| SMA period | SMA current | SMA prev | SMA prev2 | | 5 day SMA | 49.34 | 49.21 | 49.19 | | 12 day SMA | 49.23 | 49.23 | 49.27 | | 20 day SMA | 49.29 | 49.25 | 49.23 | | 35 day SMA | 49.12 | 49.09 | 49.05 | | 50 day SMA | 48.88 | 48.86 | 48.84 | | 100 day SMA | 47.98 | 47.93 | 47.89 | | 150 day SMA | 46.22 | 46.17 | 46.13 | | 200 day SMA | 45.79 | 45.76 | 45.74 |
|
|
