AcmeUnited ACU full analysis,charts,indicators,moving averages,SMA,DMA,EMA,ADX,MACD,RSIAcme United ACU WideScreen charts, DMA,SMA,EMA technical analysis, forecast prediction, by indicators ADX,MACD,RSI,CCI AMEX stock exchange
Daily price and charts and targets AcmeUnited Strong Daily Stock price targets for AcmeUnited ACU are 38.29 and 40.18 | Daily Target 1 | 36.86 | | Daily Target 2 | 37.82 | | Daily Target 3 | 38.753333333333 | | Daily Target 4 | 39.71 | | Daily Target 5 | 40.64 |
Daily price and volume Acme United
| Date |
Closing |
Open |
Range |
Volume |
Thu 23 October 2025 |
38.77 (1.28%) |
38.10 |
37.80 - 39.69 |
1.6408 times |
Wed 22 October 2025 |
38.28 (1.4%) |
37.75 |
37.55 - 38.28 |
0.5564 times |
Tue 21 October 2025 |
37.75 (0.29%) |
38.00 |
37.75 - 38.45 |
1.0803 times |
Mon 20 October 2025 |
37.64 (-1.52%) |
38.75 |
37.64 - 38.77 |
0.6622 times |
Fri 17 October 2025 |
38.22 (0.82%) |
37.91 |
37.91 - 39.33 |
1.2575 times |
Thu 16 October 2025 |
37.91 (-1.15%) |
38.04 |
37.78 - 38.39 |
0.3309 times |
Wed 15 October 2025 |
38.35 (-0.05%) |
38.22 |
38.00 - 38.56 |
0.603 times |
Tue 14 October 2025 |
38.37 (0.37%) |
38.02 |
37.99 - 38.85 |
1.0426 times |
Mon 13 October 2025 |
38.23 (-0.18%) |
38.31 |
37.94 - 38.72 |
1.1431 times |
Fri 10 October 2025 |
38.30 (-1.06%) |
38.60 |
37.81 - 39.16 |
1.6832 times |
Thu 09 October 2025 |
38.71 (-1.93%) |
39.09 |
38.00 - 39.54 |
2.7259 times |
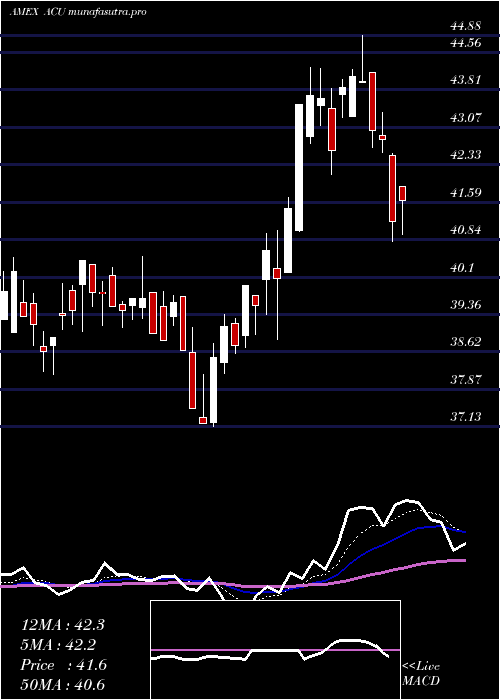
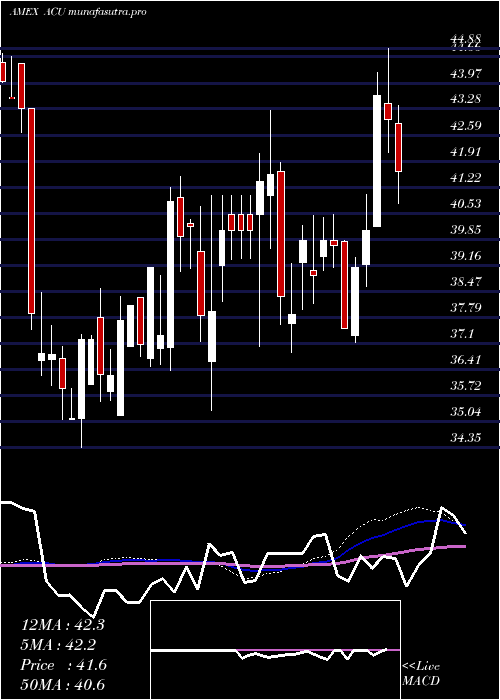
Weekly price and charts AcmeUnited Strong weekly Stock price targets for AcmeUnited ACU are 38.16 and 40.3 | Weekly Target 1 | 36.53 | | Weekly Target 2 | 37.65 | | Weekly Target 3 | 38.67 | | Weekly Target 4 | 39.79 | | Weekly Target 5 | 40.81 |
Weekly price and volumes for Acme United
| Date |
Closing |
Open |
Range |
Volume |
Thu 23 October 2025 |
38.77 (1.44%) |
38.75 |
37.55 - 39.69 |
0.6576 times |
Fri 17 October 2025 |
38.22 (-0.21%) |
38.31 |
37.78 - 39.33 |
0.7306 times |
Fri 10 October 2025 |
38.30 (-3.99%) |
40.00 |
37.81 - 41.19 |
1.2866 times |
Fri 03 October 2025 |
39.89 (-3.76%) |
41.13 |
39.89 - 41.57 |
0.8153 times |
Fri 26 September 2025 |
41.45 (-4.69%) |
43.08 |
40.80 - 43.16 |
0.8491 times |
Fri 19 September 2025 |
43.49 (6%) |
40.82 |
40.44 - 43.70 |
2.258 times |
Fri 12 September 2025 |
41.03 (-7.51%) |
43.77 |
40.79 - 44.99 |
1.5725 times |
Fri 05 September 2025 |
44.36 (3.11%) |
43.02 |
41.99 - 45.25 |
0.9519 times |
Fri 29 August 2025 |
43.02 (0%) |
43.17 |
42.50 - 43.17 |
0.0671 times |
Fri 29 August 2025 |
43.02 (-0.39%) |
42.60 |
40.32 - 43.44 |
0.8114 times |
Fri 22 August 2025 |
43.19 (5.55%) |
41.49 |
38.76 - 43.22 |
0.7778 times |
Monthly price and charts AcmeUnited Strong monthly Stock price targets for AcmeUnited ACU are 36.29 and 40.03 | Monthly Target 1 | 35.46 | | Monthly Target 2 | 37.12 | | Monthly Target 3 | 39.203333333333 | | Monthly Target 4 | 40.86 | | Monthly Target 5 | 42.94 |
Monthly price and volumes Acme United
| Date |
Closing |
Open |
Range |
Volume |
Thu 23 October 2025 |
38.77 (-5.85%) |
41.02 |
37.55 - 41.29 |
0.5699 times |
Tue 30 September 2025 |
41.18 (-4.28%) |
43.02 |
40.26 - 45.25 |
1.1047 times |
Fri 29 August 2025 |
43.02 (7.07%) |
40.00 |
38.76 - 44.64 |
0.6625 times |
Thu 31 July 2025 |
40.18 (-3.06%) |
41.02 |
40.01 - 44.88 |
1.0553 times |
Mon 30 June 2025 |
41.45 (4.15%) |
39.80 |
37.13 - 41.67 |
2.6764 times |
Fri 30 May 2025 |
39.80 (3.32%) |
38.78 |
36.85 - 40.48 |
1.0047 times |
Wed 30 April 2025 |
38.52 (-2.75%) |
39.47 |
35.31 - 43.24 |
1.1611 times |
Mon 31 March 2025 |
39.61 (1.33%) |
36.97 |
36.38 - 41.50 |
0.6628 times |
Fri 28 February 2025 |
39.09 (7.83%) |
35.20 |
35.20 - 39.09 |
0.4842 times |
Fri 31 January 2025 |
36.25 (-2.89%) |
36.98 |
34.35 - 38.54 |
0.6184 times |
Tue 31 December 2024 |
37.33 (-15.18%) |
43.59 |
35.97 - 44.66 |
0.6124 times |
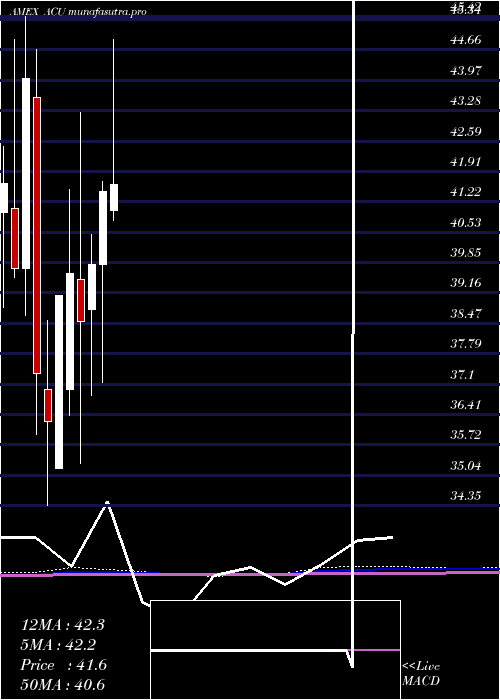
DMA SMA EMA moving averages of Acme United ACU
DMA (daily moving average) of Acme United ACU
| DMA period | DMA value | | 5 day DMA | 38.13 | | 12 day DMA | 38.33 | | 20 day DMA | 39.2 | | 35 day DMA | 40.48 | | 50 day DMA | 40.86 | | 100 day DMA | 41.05 | | 150 day DMA | 40.51 | | 200 day DMA | 39.73 | EMA (exponential moving average) of Acme United ACU
| EMA period | EMA current | EMA prev | EMA prev2 | | 5 day EMA | 38.3 | 38.07 | 37.97 | | 12 day EMA | 38.58 | 38.55 | 38.6 | | 20 day EMA | 39.12 | 39.16 | 39.25 | | 35 day EMA | 39.88 | 39.95 | 40.05 | | 50 day EMA | 40.75 | 40.83 | 40.93 |
SMA (simple moving average) of Acme United ACU
| SMA period | SMA current | SMA prev | SMA prev2 | | 5 day SMA | 38.13 | 37.96 | 37.97 | | 12 day SMA | 38.33 | 38.37 | 38.52 | | 20 day SMA | 39.2 | 39.34 | 39.5 | | 35 day SMA | 40.48 | 40.65 | 40.76 | | 50 day SMA | 40.86 | 40.94 | 41.07 | | 100 day SMA | 41.05 | 41.06 | 41.08 | | 150 day SMA | 40.51 | 40.52 | 40.53 | | 200 day SMA | 39.73 | 39.71 | 39.7 |
|
|
